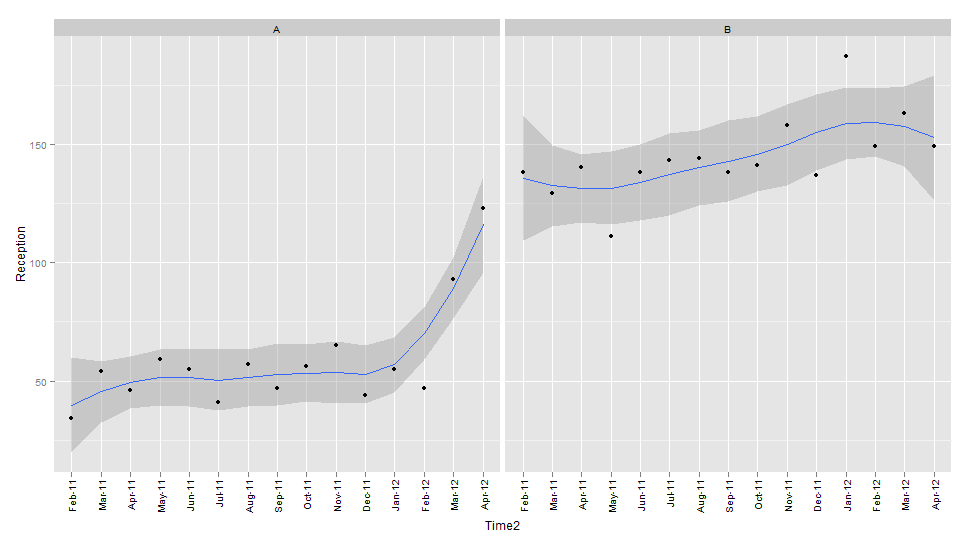
This is Statistics 101, but I'm not a statistician and so can't seem to find the right technical jargon to google.
My company collects data at discrete points through time. Today's datapoint is positioned somewhat differently to the others, and so we're having a debate about whether this is an accident of chance or indicative of an actual underlying effect. What side you're on depends on how you eyeball the data, but we need to be able to detect these going forward. It is essentially a question of threshold placement.
"Given a set of datapoints through time, how different does a given datapoint have to be before it can be considered anomalous?", and "How unlikely is a given deviant point to have occurred simply by chance?"
Is this a simple question of outliers or standard deviations? Does the question require some kind of model-fitting to be solvable? I was originally thinking in terms of p-values and hypotheses here - as in, assuming a null hypothesis that the suspect datapoint is just a product of chance, could we calculate the probability of this null hypothesis being true in light of the data?
I don't even need a complete answer here, just pointers in the right direction. There must be a better way to decide these things than eyeballing.

