3
$\begingroup$

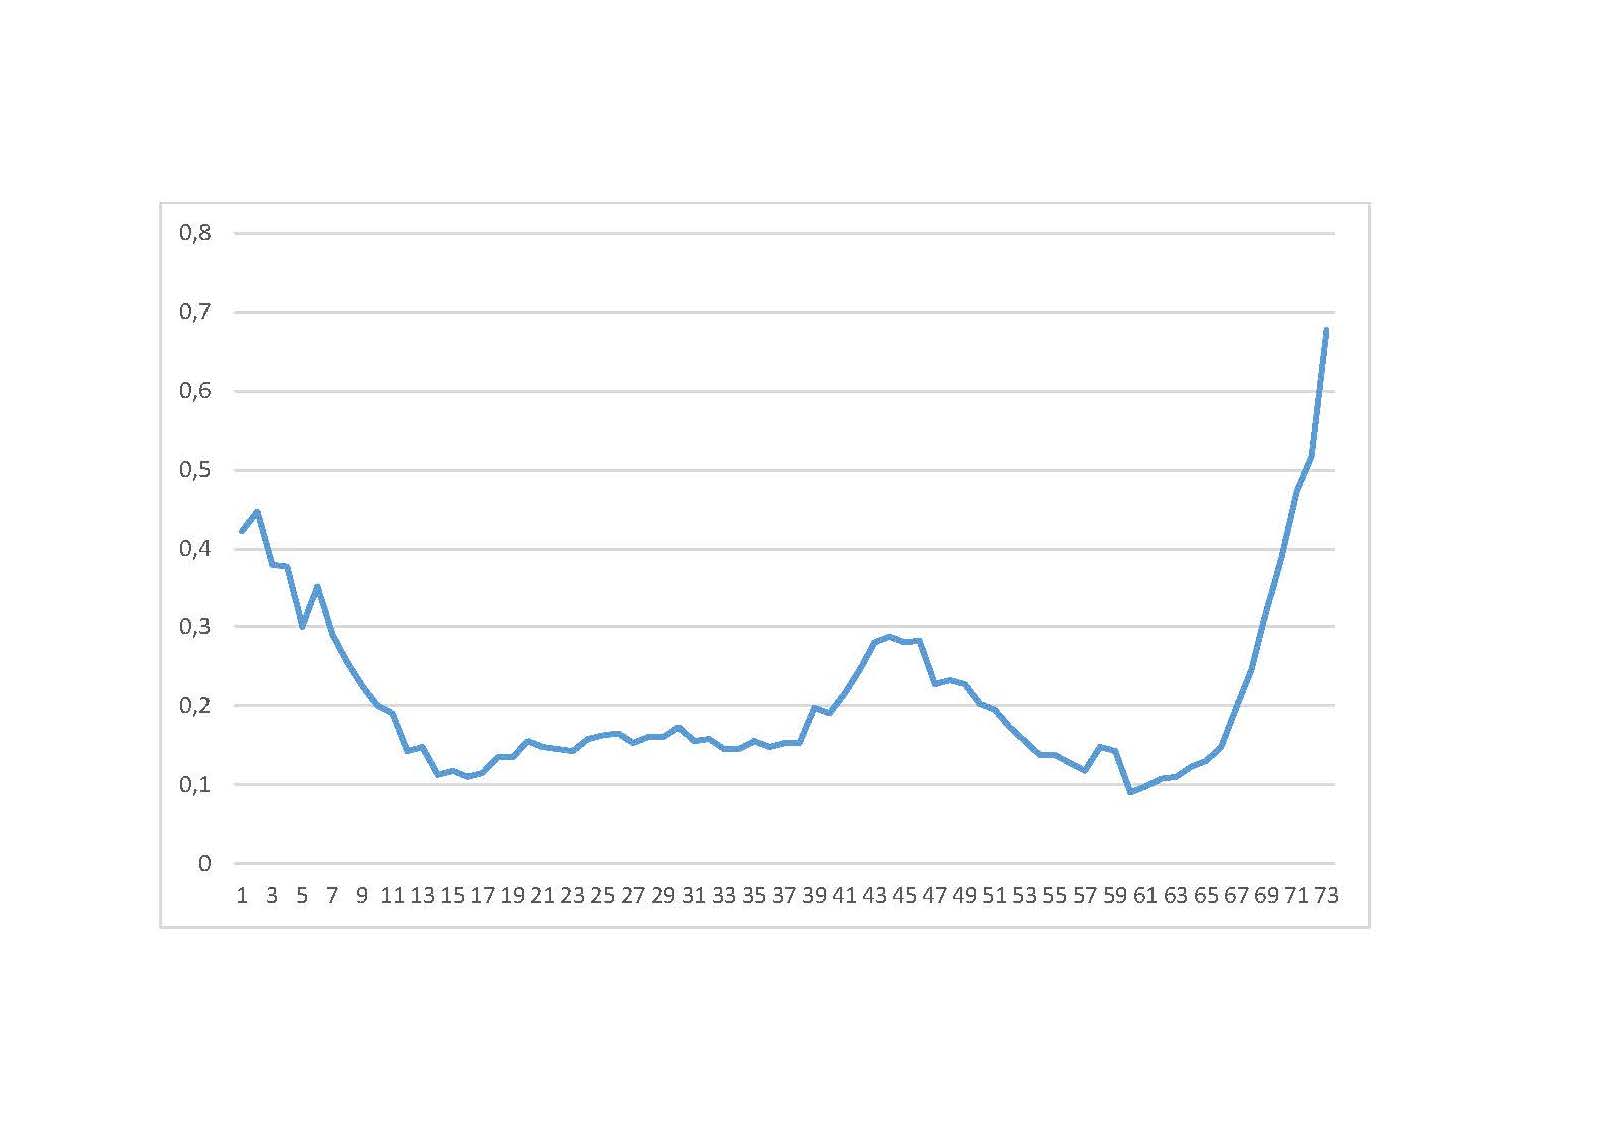
I have some trouble with a specific time series. The time series itself is pretty short: Only 73 observations that look like this:

enter image description here

First problem: Detrend or not?

First I need to find out if the time series has a unit root or not. Using the augmented Dickey-Fuller Test the null hypothesis cannot be rejected, therefore I have to assume that the time series has a unit root. Based on this paper one should check this result with another test because the time series is pretty short.

Using the Philips-Perron Test I get the same result (again: the time series has a unit root) but using the KPSS Test I get a contradicting result. Based on the KPSS Test one cannot reject the null hypothesis which states that the time series has no deterministic trend.

I know that unit root and deterministic trend are two different things that are hard to distinguish. But overall I would say that the time series has a trend.

Second problem: Take logarithm or not?

For many time series (e.g., GDP) one has to take the logarithm first because most detrending methods (e.g., Hodrick-Prescott Filter) are linear filters. Apart from that GDP looks pretty exponential so taking log first is probably not the worst idea. But for some time series, especially interest rates or a share of two variables (which is the case for my time series), one does not take the logarithm. But why? Detrending my time series with and without taking the natural logarithm first I get totally different results for the trend and the cyclical component.

Why would I bother?

The reason I have to detrend the time series is that I want to analyze the time series over a business cycle. Therefore if I want to compare (or merge) different business cycles I have to detrend the series from non-cyclical aspects.

To be honest using log first gives better results – but I don't think this is a valid basis on which to answer these questions.

$\endgroup$

1 Answer 1

1
$\begingroup$

See How to detect seasonality from plotted data without using tools or libraries and the link to when and why you should take logs might be of help to you. Untreated deterministic structure .. pulses/level shifts/time trends often incorrectly suggest transforms. Visually you series might have changes in trends AND/OR changes in intercepts in addition to some form of ARIMA structure . If you post your data I will try and help further.

Detrending , Power Transformations .Differencing AND ARMA are all forms of transformations. Determining the minimally sufficient (parsimonious) combination requires skillful techniques . Simple scripts i.e. hard and fast rules are to be studiously avoided as they limit the scope of the solution and often obfuscate.

I should also add there are two other forms of transformations often suggested by the data ...

  1. Due to changes in parameters over time SEGMENT the data
  2. Due to deterministic error variance change(s) over time employ Weighted Least Squares (GLS)

The opportunity space , correctly evaluated , can often lead to a "useful model" ...ala GEPB

EDITED AFTER RECEIPT OF DATA .

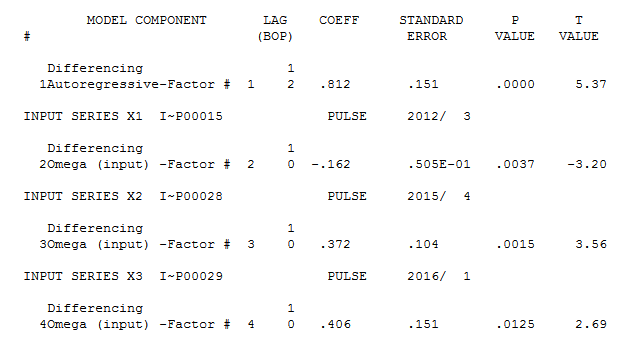
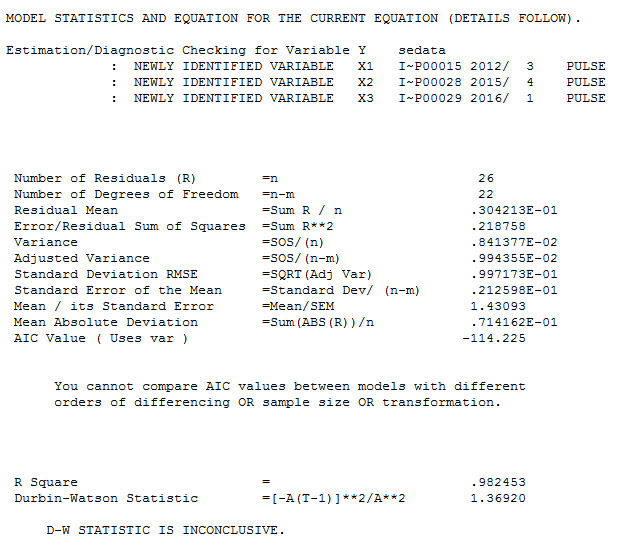
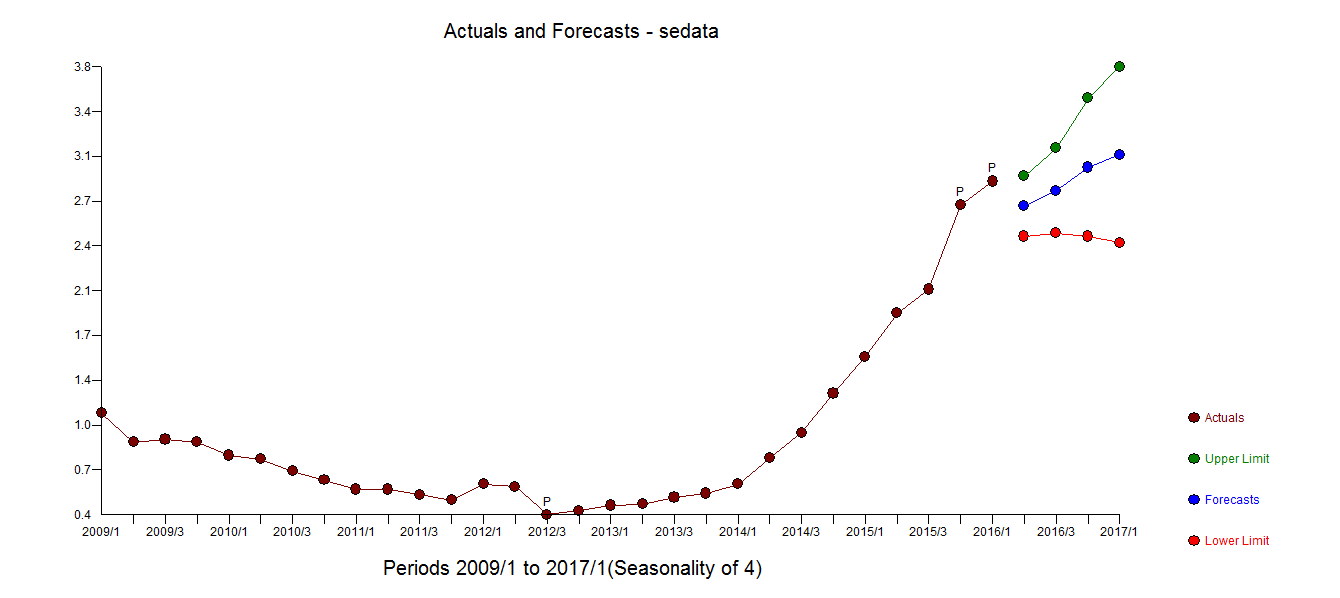
Using AUTOBOX , a piece of software that I have helped to develop the following model was automatically developed. First differences with an AR(2) without lag 1 and three pulses ... two of them at the end of the series. ... using the most recent 29 values. Note that an AR(2) model does not necessarily include both lags whereas some solutions requires that to be true (auto.arima for example )

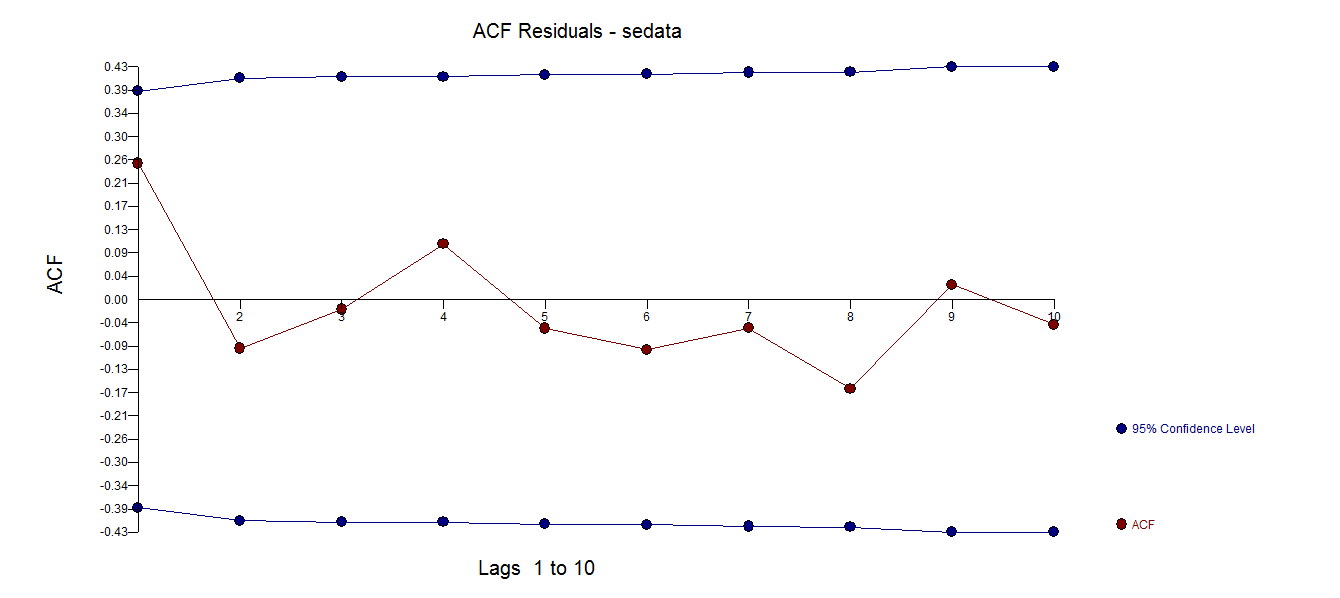
The statistics are here enter image description here and here enter image description here . The ACF of the residuals enter image description here .

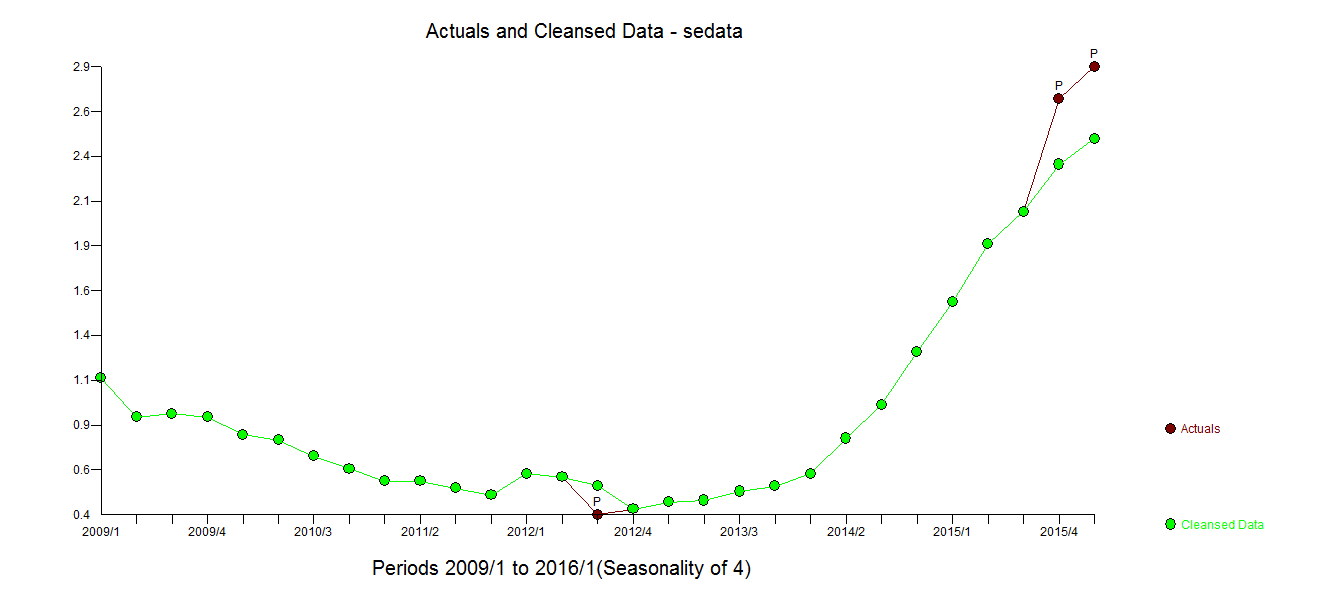
The Actual and Adjusted Plot highlights the "unusual values" enter image description here . Of particular interest are the two anomalies at the tail-end of the series (information extracted from the Data) . If one were to believe these two values rather than "adjusting for them" the subsequent forecast would be higher as compared to this forecast enter image description here

A possible useful model would then have no power transform , no weighted least squares BUT have differences, arma and three pulses after having segmented the data into 1-44 AND 45-73 distinct time ranges.

enter image description here

$\endgroup$
10
  • $\begingroup$ Thank you for your answer and the link. I'm currently reading it. The data are from the following link fred.stlouisfed.org/series/CORALACBS (the time frame is from 1991:Q3-2009:Q2). $\endgroup$
    – PAS
    Commented Nov 2, 2017 at 14:21
  • $\begingroup$ (Not sure if you are still editing your post) Thank you very much for all the hard work. I don't really understand everything you do but it looks like there is a break in the data (between 44 und 45) but I'm a little bit confused why you only plot the values from 2009 to 2017. $\endgroup$
    – PAS
    Commented Nov 2, 2017 at 16:14
  • $\begingroup$ I inadvertently specified the rong starting point ...must be old age .. The values/analyses are correct .. the graphs should start 44 periods later 2002/3 ..GOOD EYES on you .. $\endgroup$
    – IrishStat
    Commented Nov 2, 2017 at 17:06
  • $\begingroup$ My interpretation of your results is the following: Do not transform the series (no log whatsoever) and the time series has a break and I should detrend it? p. s. I added some further information in my original post under the point "Why would I bother" $\endgroup$
    – PAS
    Commented Nov 2, 2017 at 17:20
  • $\begingroup$ Don't detrend BUT differ which is a an improvement over detrending in this case. This will leave an adjusted series with an AR(1) component. If you use the residuals from the AUTOBOX suggested model this represents a purging of within-series structure including short term memory leaving a residue for you to plum. $\endgroup$
    – IrishStat
    Commented Nov 2, 2017 at 17:46

Your Answer

By clicking “Post Your Answer”, you agree to our terms of service and acknowledge you have read our privacy policy.

Not the answer you're looking for? Browse other questions tagged or ask your own question.