6
$\begingroup$

In a simple experiment with the normal distribution in R I ran 500 iterations of a simulated normal distribution with N=100 each. For each iteration from the 500 iterations, I calculated both the mean and the trimmed mean with 20% trim (from each side), resulting in 500 values for each. Then, I compared the values of both with a boxplot: Boxplot (mean vs trimmed mean)
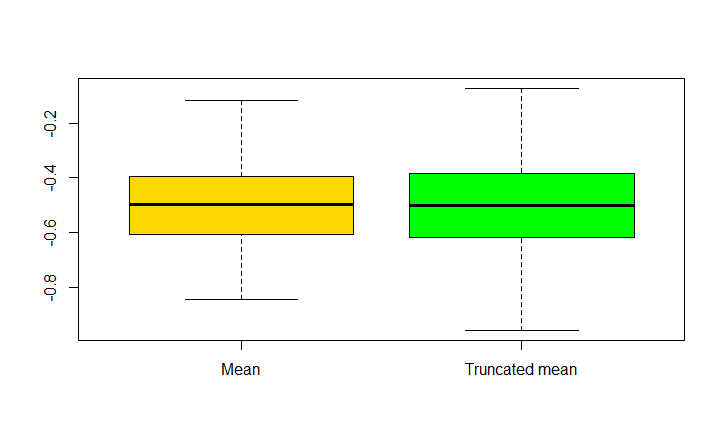
It seems that the mean values are more "precise". I have managed to reproduce these results in almost all tries, and in the tries that I couldn't, the boxplot resulted in a similar plot for each.

This feels a bit counter-intuitive. I expected for it to be the other way around, since the 20% trim will remove results with high deviation. The only explanation I was able to think of for this observation is that the trim removes data that would otherwise "balance" the mean, though, it's not a formal explanation.

Would love some insights on this observation, thanks!

$\endgroup$
1
  • 1
    $\begingroup$ It might help to contemplate what your procedure would do with much smaller sample sizes, such as $n=5$ or even $n=3$. $\endgroup$
    – whuber
    Commented Nov 4, 2017 at 19:54

2 Answers 2

11
$\begingroup$

For an exponential family like the Normal distribution, the sample average $\bar{x}$ is know to achieve the Cramér-Rao lower bound, that is the minimal possible variance among all unbiased estimators of the mean. It is thus no surprise that another estimator such as the trimmed mean is found to be more variable than $\bar{x}$.

$\endgroup$
11
$\begingroup$

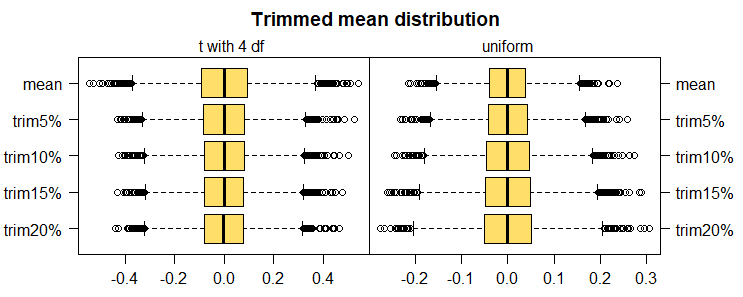
With a light-tailed distribution, the more distant points are most informative about location; with a heavier-tailed distribution their inclusion in an average may be anything from unhelpful to ruinous.

So when you use a suitably-trimmed mean with a heavy-tailed distribution, it will tend to have a lower variance than not trimming. On the other hand when you do it with a light-tailed distribution, you're throwing away valuable data (and so your estimate is noisier, somewhat like it would be if you had a smaller sample)

If you look at say a $t_4$ distribution you can see some gain from trimming. If you look at a uniform on $(-k,k)$, you can see a cost from trimming (indeed, you'd be better still to average the trimmed-off values at some very small level of trimming than to use the mean).

boxplots of sampling distribution of 0%, 5%, 10%, 15% and 20% trimmed means for t4 and uniform data; the boxplots show initially decreasing spread with trim percentage for the t4 but constantly increasing spread with trim percentage for the uniform

These simulations were for n=100 in each case.

$\endgroup$

Your Answer

By clicking “Post Your Answer”, you agree to our terms of service and acknowledge you have read our privacy policy.

Not the answer you're looking for? Browse other questions tagged or ask your own question.