0
$\begingroup$

I have store level data which can range from 3 months to 1 year. This data is basically store weekly level data. For a given store I want to cluster stores as similar stores based on any input variable like sales, count of customers etc.

The criterion for saying that a store is similar to another store is that "the magnitude as well as the trend of the two stores should match" i.e. if I want to define two stores as similar stores on "count of customers in a store" then both the stores should have the same magnitude as well as the same trend of number of customers visiting the store weekly.

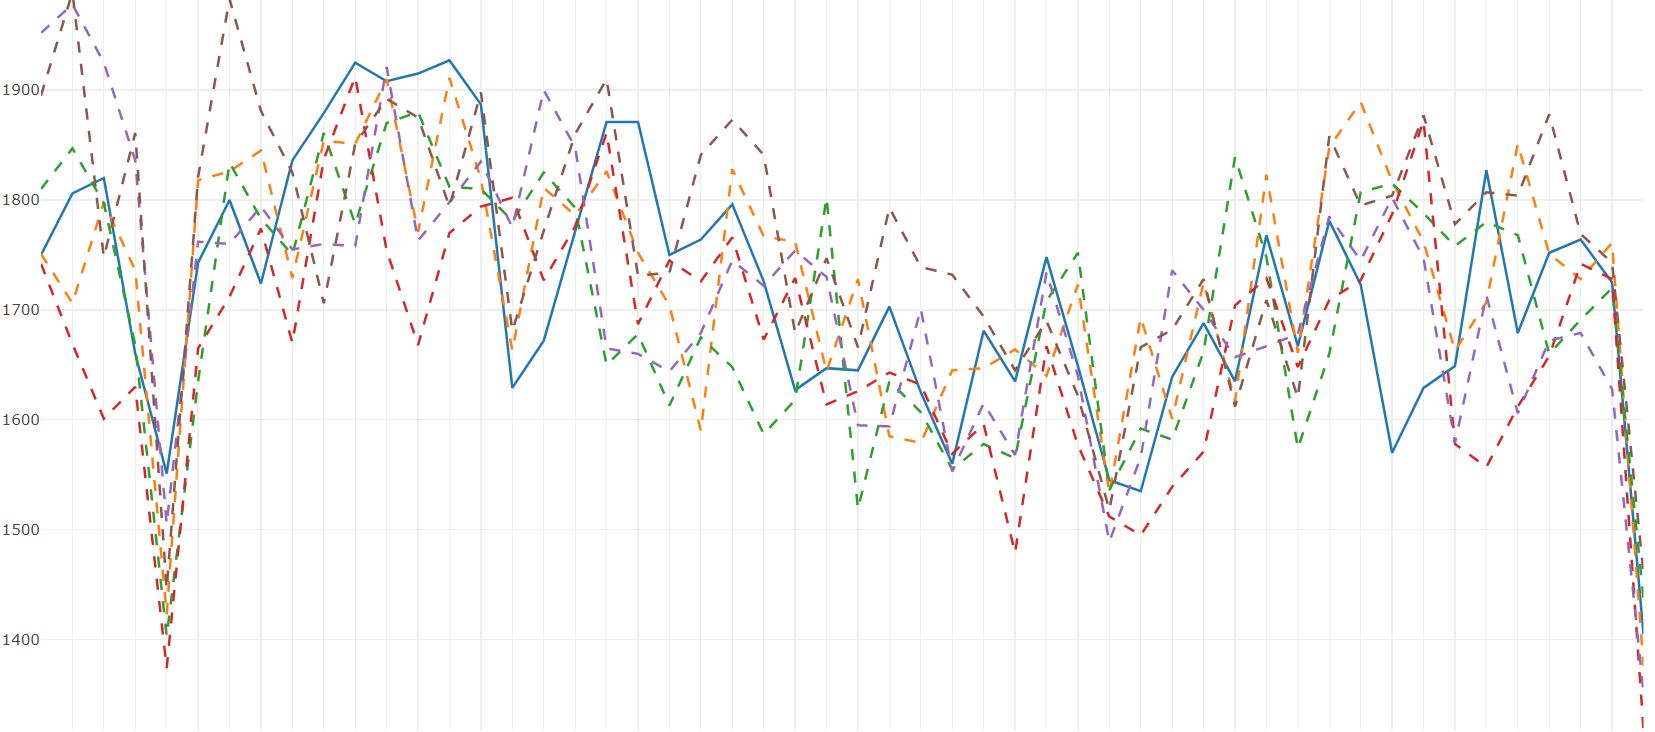
I tried DTW (dynamic time warping) to segregate the store level data into various clusters, but the problem is that the magnitude of clustered store matches but trend does not.

enter image description here

If I try using correlation to match the trend of the store then the magnitude does not match.

enter image description here

What should be the optimum way so that both magnitude and trend can match, something like this?

enter image description here

$\endgroup$

2 Answers 2

1
$\begingroup$

The following paper offers an approach for clustering time series on magnitude and trend (or as they refer to them in the paper: distribution and dependence). They provide a parameter for weighing between the two.

Donnat, Philippe, Gautier Marti, and Philippe Very. "Toward a generic representation of random variables for machine learning." Pattern Recognition Letters 70 (2016): 24-31. https://arxiv.org/abs/1506.00976

They also have code available in python.

$\endgroup$
0
$\begingroup$

The criterion that “the magnitude as well as the trend of the two stores should match” is simply a bad one! The problem is that small differences in magnitude (normally called offset) dwarf differences in shape. If you want to consider both at the same time, you need to come up with a weighting parameter to say how important each is; they are only superficially in the same units.

You almost certainly do NOT want to use DTW.

If I had to guess (without picking your brain more): use z-normalized Euclidean distance; then examine the visual plots of each cluster, without z-normalization.

$\endgroup$

Your Answer

By clicking “Post Your Answer”, you agree to our terms of service and acknowledge you have read our privacy policy.

Not the answer you're looking for? Browse other questions tagged or ask your own question.