8
$\begingroup$

Consider elastic net regression with glmnet-like parametrization of the loss function$$\mathcal L = \frac{1}{2n}\big\lVert y - \beta_0-X\beta\big\rVert^2 + \lambda\big(\alpha\lVert \beta\rVert_1 + (1-\alpha) \lVert \beta\rVert^2_2/2\big).$$ I have a data set with $n\ll p$ (44 and 3000 respectively) and I am using repeated 11-fold cross-validation to select the optimal regularization parameters $\alpha$ and $\lambda$. Normally I would use squared error as the performance metric on the test set, e.g. this R-squared-like metric: $$L_\text{test} = 1-\frac{\lVert y_\text{test} - \hat\beta_0 - X_\text{test}\hat\beta\rVert^2}{\lVert y_\text{test} - \hat\beta_0\rVert^2},$$ but this time I also tried using correlation metric (note that for the un-regularized OLS regression minimizing the squared error loss is equivalent to maximizing the correlation): $$L_\text{test}=\operatorname{corr}(y_\text{test}, X_\text{test}\hat\beta).$$

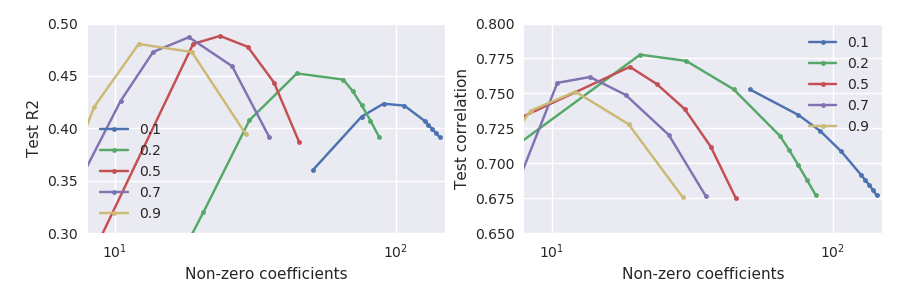
It's clear that these two performance metrics are not exactly equivalent, but weirdly, they disagree rather strongly:

Elastic net cross-validation

Note in particular what happens at small alphas, e.g. $\alpha=.2$ (green line): maximum test-set correlation is achieved when test-set $R^2$ drops quite substantially compared to its maximum. In general, for any given $\alpha$, correlation seems to be maximized at larger $\lambda$ than squared error.

Why does it happen and how to deal with it? Which criterion should be preferred? Has anybody encountered this effect?

$\endgroup$
10
  • $\begingroup$ Are the CV folds exactly the same in each experiment? $\endgroup$ Commented Feb 5, 2018 at 8:43
  • $\begingroup$ @AlexeyBurnakov Yes. The loop over regularization parameters is inside the loop over folds. $\endgroup$
    – amoeba
    Commented Feb 5, 2018 at 8:45
  • $\begingroup$ If the models in both charts are also the same, I would say the results does not make sense until there is some mistake in calculation. I tried elasticnet, but not with those performance metrics. $\endgroup$ Commented Feb 5, 2018 at 8:57
  • $\begingroup$ in fact, with CV the loss metric is being averaged over test folds, and in your case the R^2 does not have to fit exactly the correlation ^ 2, does it? Maybe the discrepancy lies in that values of either loss metric are very uneven across the CV test folds? E.g., 0.5, 0.9, 0.1, 0.99, 0.05, which averaging would produce some bizarre figure in the end completely mismatched with that of the other one? $\endgroup$ Commented Feb 5, 2018 at 9:05
  • 1
    $\begingroup$ Not sure what you meant by that @AlexeyBurnakov. But in any case, see the answer that I have just posted. $\endgroup$
    – amoeba
    Commented Feb 5, 2018 at 15:57

1 Answer 1

6
$\begingroup$

I think I figured out what was happening here.

Note that the value of correlation does not depend on the length of $\hat\beta$. So if the test correlation keeps increasing while the test R-squared drops, it might indicate that $\lVert\hat\beta\rVert$ is not optimal and scaling $\hat\beta$ up or down by a scalar factor might help.

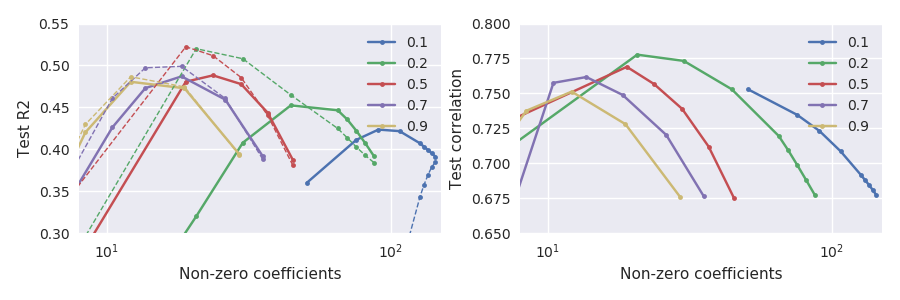
After realizing this, I remembered that there have been multiple claims in the literature that elastic net, and even lasso on its own, "over-shrinks" the coefficients. For lasso, there is the "relaxed lasso" procedure that aims to amend this bias: see Advantages of doing "double lasso" or performing lasso twice?. For elastic net, the original Zou & Hastie 2005 paper actually advocated up-scaling $\hat\beta$ by a constant factor, see Why does glmnet use "naive" elastic net from Zou & Hastie original paper?. Such scaling would not change the value of correlation but would affect the R-squared.

When I apply the Zou & Hastie heuristic scaling $$\hat\beta^* = \big(1+\lambda(1-\alpha)\big)\hat\beta,$$ I obtain the following result:

enter image description here

Here the solid lines are the same as in the figure in my question whereas the dashed lines on the left subplot use the re-scaled beta. Now both metrics are maximized by around the same values of $\alpha$ and $\lambda$.

Magic!

$\endgroup$
1
  • 1
    $\begingroup$ Well done! Subtle... $\endgroup$ Commented Feb 5, 2018 at 17:06

Your Answer

By clicking “Post Your Answer”, you agree to our terms of service and acknowledge you have read our privacy policy.

Not the answer you're looking for? Browse other questions tagged or ask your own question.