1
$\begingroup$

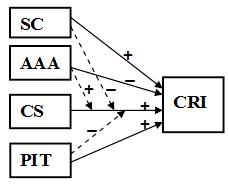
I did hierarchical regression analysis on my data due to having moderation effects in my research model.
enter image description here

R2 increased from .695 in model1 (main effect only) to .734 in model2 (main &interaction effects)(sig. F change = .000). All the assumptions for the regression analysis have been met. I have two problems with the "coefficients" table: enter image description here
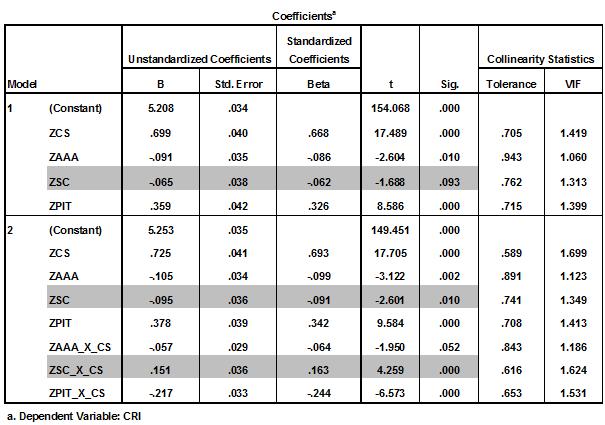
  1. As u can see in the table, the insignificant beta value of ZSC in model1 became significant in model2! Is it ok? I'm confused! Which value should i consider to reject/accept the related hypothesis? B of model1 (which rejects the hypothesis) or 2 (which confirms it!!)?

  2. Although the Beta value for ZSC_X_CS is significant, its positive sign is against the hypothesis! it's supposed to have a negative sign according to the literature & also logic! How should i treat this hypothesis? Accept? Reject? Partially accept?!!!

TQ.
enter image description here

$\endgroup$
7
  • $\begingroup$ Just so we're all on the same page - can you define (or link) to what you mean by "moderation" - I'm familiar with it to mean, in some sense, interaction, but I'm not sure that's what you're saying here. $\endgroup$
    – Macro
    Commented Jul 19, 2012 at 20:30
  • $\begingroup$ Yes, I mean interaction. for example, in my model SC moderates the relationship between CS and the dependent variable. $\endgroup$
    – Cyrus
    Commented Jul 19, 2012 at 20:37
  • $\begingroup$ OK, it wasn't clear there were interactions in the model - I suppose the final three terms in the second model are the interactions? $\endgroup$
    – Macro
    Commented Jul 19, 2012 at 20:37
  • $\begingroup$ Yes, that's right. $\endgroup$
    – Cyrus
    Commented Jul 19, 2012 at 20:40
  • $\begingroup$ Re: your first question, is ZMCS collinear with any of the interaction terms? It's not clear to me from the variable names. Re: your second question, in that case you should be doing a one-sided test of whether or not $\beta < 0$. A positive estimate for $\beta$ will surely lead to a situation where you are not rejecting that null hypothesis. $\endgroup$
    – Macro
    Commented Jul 19, 2012 at 20:50

2 Answers 2

4
$\begingroup$

First, when you ask different questions, you get different answers. Your two models ask different questions. One asks about a model that includes an interaction, one asks about a model that does not. There's no reason to expect consistency.

Second, the difference between significance and non-significance is not significant. (With a hat tip to Andrew Gelman, who came up with that sentence).

Third, since you don't provide any context, it's hard to know what's going on regarding what's "supposed" to happen.

And finally, when dealing with interactions, it's often helpful to make a plot of the predicted outcomes at different levels of the IVs.

$\endgroup$
1
  • 1
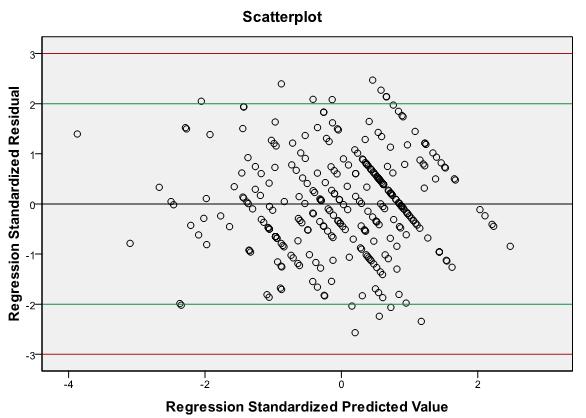
    $\begingroup$ Thanks Peter. I think i'm clear on my 1st Q now. SC stands for Switching Costs, CS 4 Customer Satisfaction, & CRI for Consumer Repurchase intention. By theory, SC positively effects CRI and negatively moderates the relationship between CS & CRI. In my results, although the strength of those relationships has been approved (p<.05) but the direction of the relationship is not confirmed & turned out 2 b vice versa which doesn't make sense. I don't know what's wrong here! I added the scatterplot to my Q & included some other specs in my 2nd comment 2 Aniko's response. Hope they will help! $\endgroup$
    – Cyrus
    Commented Jul 21, 2012 at 0:04
1
$\begingroup$

For simplicity, I will ignore the variables other than ZSC and ZSC, and will call them $X$ and $Y$ (their names are too similar for me). You obtained two regression models: $$CRI = 5 + 0.7 X - 0.06 Y$$ and $$CRI = 5 + 0.72 X - 0.1 Y + 0.15 X Y $$ The meaning of the coefficient of $Y$ in the first model is the following: if $Y$ is increased by one unit, then regardless of the value of $X$, the outcome is changed by $-0.06$.

Its meaning in the second model is: if $Y$ is increased by one unit and $X=0$, then the outcome is changed by $-0.1$. But, if say $X=1$, then the effect of one unit of change in $Y$ is $-0.1+0.15=0.05$, and if $X=-1$ then the effect is $-0.25$.

The moral is that the meaning of the "main effect" term changes when you add interaction, so there should be no surprise if its significance changes, especially if the interaction is non-negligible. In a certain sense, when you fitted the first model, you averaged over all the possible values of $X$ in $-0.1 Y + 0.15 X Y$. Also, the first model is clearly wrong (because it assumes no interaction when there is one), so any inference from it is wrong as well.

Perhaps rewriting the right side as $= 5 + 0.72 X + (0.15 X - 0.1) Y$ would help. The effect of $Y$ could be positive or negative depending on whether $0.15X < 0.1$ or not. You have to put these values into the context of the actual problem. What does $X=0$ mean? what does $Y=0$ mean? etc.

$\endgroup$
5
  • $\begingroup$ Thank you Aniko for your time and good answer. I got the answer to my 1st question. I will forget about the hierarchical regression & will just consider the results of the combination of the main&interaction effects. $\endgroup$
    – Cyrus
    Commented Jul 20, 2012 at 23:34
  • $\begingroup$ But i'm still not clear about my 2nd question. Beta of ZSC is supposed to have a positive sign and ZSC_X_CS should have a negative sign. but in the results it's vice versa!! I've deleted most of the outliers in the standardized residual, the p-value of Breusch-Pagan test for Heteroscedasticity is 0.3016, the value of the Durbin-Watson is 2.035, the p-value of Shapiro-Wilk test of normality is 0.448 and R2 Linear is 0. Seems that all assumptions have been met. I cant get what's causing that problem!! How should i treat their related hypotheses? I'm confused! $\endgroup$
    – Cyrus
    Commented Jul 20, 2012 at 23:40
  • $\begingroup$ That plot is nice, but it sure looks like the dependent variable is not continuous. Is CRI on an ordinal scale? Did you try ordinal logistic regression? $\endgroup$
    – Peter Flom
    Commented Jul 21, 2012 at 12:27
  • $\begingroup$ @Aniko, the OP's results are from linear regression, not logistic. You may want to rewrite your answer because right now it's just not applicable, I'm afraid. Also, I differ with you when you say "the first model is clearly wrong (because it assumes no interaction when there is one), so any inference from it is wrong as well." It is a matter of judgment whether a set of 3 interactions that collectively take r-squared from .70 to .73 is worth preserving. $\endgroup$
    – rolando2
    Commented Jul 21, 2012 at 17:27
  • $\begingroup$ @rolando2 Oops, thanks for noticing. I changed the logistic model to linear regression. $\endgroup$
    – Aniko
    Commented Jul 21, 2012 at 20:56

Your Answer

By clicking “Post Your Answer”, you agree to our terms of service and acknowledge you have read our privacy policy.

Not the answer you're looking for? Browse other questions tagged or ask your own question.