At the moment I'm tryin to do research about a classification problem in the area of product data management. The aim is to provide some guidance concerning the machine learning techniques, which can be used to solve the classification problem. In the following I will show you my procedure to do so. I would really appreciate if you could point out errors in the general procedure, or in a specific step.
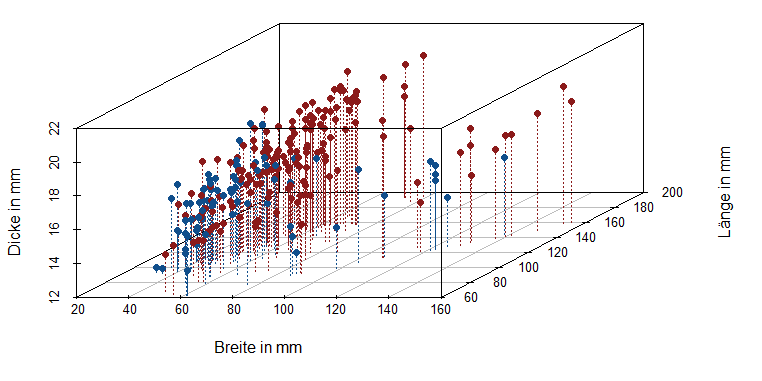
At first, the data: I've collected a dataset about brake pads (275 data points). A brake pad can be used in the front of a car (red points in graphic below), or in the back (blue points). This is also the class that shall be predicted used a technique. The attributes used to predict are length, height, and thickness of the brakepads.

Now I want to argue about different machine learning techniques based on the dataset. This argumentation shall help to argue about a larger dataset with more variables, but otherwise quite similar (I can't work on that data directly because I can not publish it later). So the aim is to argue about the techniques which can be used to perform the classification.
To do so I create one hundred test and train datasets from the shown data. The data points are picked randomly, and I've distributed the classes symmetrically. So, the training data has 132 points and the test set has 30 points, with three attributes (length, width, thickness) and the class (front or back of the car).
Then I apply three machine learning techniques to each of the dataset: kNN, logistic regression, and random forest. I've set the parameters (for instance k for kNN, or the number of trees for random forest) via cross-validation.
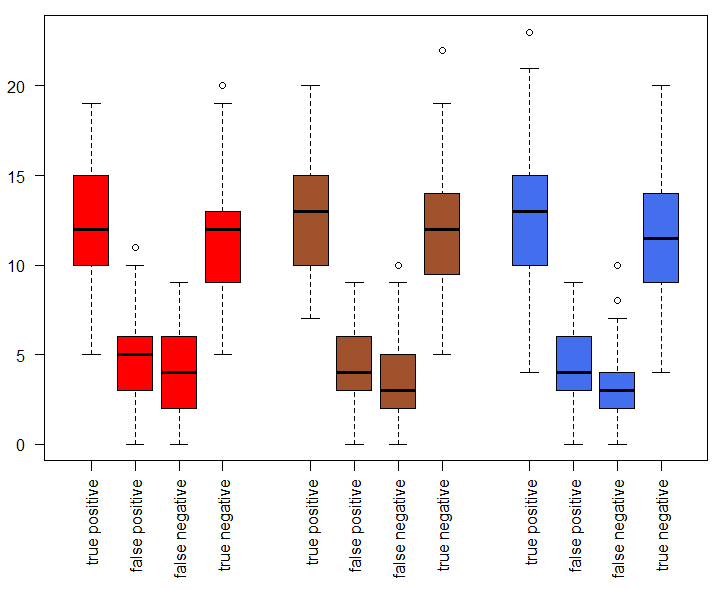
The result I want for arguing about the techniques is the confusion table generated by each of the techniques for each of the datasets on the test data. This means I've one hundred predictions on the randomly generated test datasets. Each of these predictions predicts some of the 30 points as true positive, some as false positive, and so on. The boxplot below shows the 100 predictions for one of the techniques and one part of a confusion table.
The red boxplots are for the confusion matrix of logistic regression, the brown ones for random forest and the blue ones for knn.
Now, the idea is to argue about the techniques based on their behaviour on this problem to later apply the results on a larger non-accessable dataset. So for instance:
The techniques show quite similar results. Nevertheless, kNN might be a better choice for this specific example, because the box for false negative and false positive are slightly smaller than for the two other methods.
Finally I want to clarify my questions:
Can I use a smaller sample dataset to argue for a larger dataset? Both are except for their scope quite similar.
I didn't wanted to argue about the techniques behaviour based on a single train and test data combination. Therefore I've created onehundred randomly selected train and test datasets and showed their results in the boxplot above. Is this a valid idea?
Thank you for reading the question! In case you have any question concering my question please ask in the comments ;).

