1
$\begingroup$

At the moment I'm tryin to do research about a classification problem in the area of product data management. The aim is to provide some guidance concerning the machine learning techniques, which can be used to solve the classification problem. In the following I will show you my procedure to do so. I would really appreciate if you could point out errors in the general procedure, or in a specific step.

At first, the data: I've collected a dataset about brake pads (275 data points). A brake pad can be used in the front of a car (red points in graphic below), or in the back (blue points). This is also the class that shall be predicted used a technique. The attributes used to predict are length, height, and thickness of the brakepads. enter image description here
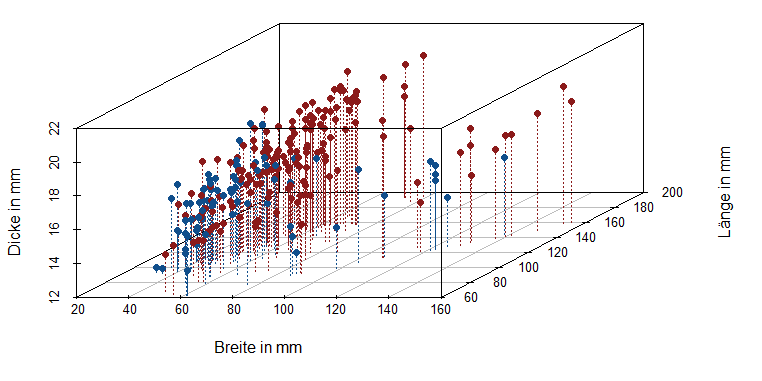
Now I want to argue about different machine learning techniques based on the dataset. This argumentation shall help to argue about a larger dataset with more variables, but otherwise quite similar (I can't work on that data directly because I can not publish it later). So the aim is to argue about the techniques which can be used to perform the classification.

To do so I create one hundred test and train datasets from the shown data. The data points are picked randomly, and I've distributed the classes symmetrically. So, the training data has 132 points and the test set has 30 points, with three attributes (length, width, thickness) and the class (front or back of the car).

Then I apply three machine learning techniques to each of the dataset: kNN, logistic regression, and random forest. I've set the parameters (for instance k for kNN, or the number of trees for random forest) via cross-validation.

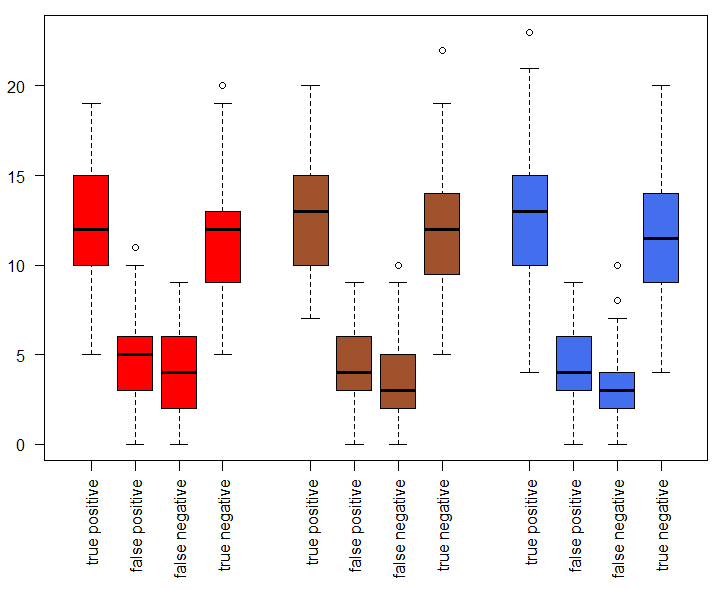
The result I want for arguing about the techniques is the confusion table generated by each of the techniques for each of the datasets on the test data. This means I've one hundred predictions on the randomly generated test datasets. Each of these predictions predicts some of the 30 points as true positive, some as false positive, and so on. The boxplot below shows the 100 predictions for one of the techniques and one part of a confusion table.

enter image description here

The red boxplots are for the confusion matrix of logistic regression, the brown ones for random forest and the blue ones for knn.

Now, the idea is to argue about the techniques based on their behaviour on this problem to later apply the results on a larger non-accessable dataset. So for instance:

The techniques show quite similar results. Nevertheless, kNN might be a better choice for this specific example, because the box for false negative and false positive are slightly smaller than for the two other methods.

Finally I want to clarify my questions:

Can I use a smaller sample dataset to argue for a larger dataset? Both are except for their scope quite similar.

I didn't wanted to argue about the techniques behaviour based on a single train and test data combination. Therefore I've created onehundred randomly selected train and test datasets and showed their results in the boxplot above. Is this a valid idea?

Thank you for reading the question! In case you have any question concering my question please ask in the comments ;).

$\endgroup$
3
  • 1
    $\begingroup$ It is not clear what you are asking, or more specifically which point you are confused about. Maybe you could extract two or three specific questions. Right now the only real question I can see is, if you can argue with the box plots. But even there I don't really understand the question. Do you mean in the sense you are trying to support a certain decision? First I'd say that the representation is not helping the message; e.g. what is the independent axis? $\endgroup$
    – cherub
    Commented Feb 20, 2018 at 13:46
  • 1
    $\begingroup$ you didn't describe your data, actually. how many variables you have? how many observations? I'm afraid you don't have enough of them to do sensible ML, and instead usual reliability stats tools could be more appropriate $\endgroup$
    – Aksakal
    Commented Feb 20, 2018 at 15:47
  • $\begingroup$ Thanks for your feedback. I've tried to clarify my questions. $\endgroup$
    – So S
    Commented Feb 20, 2018 at 21:23

2 Answers 2

1
$\begingroup$

Can I now argue with the boxplots?

These boxplots do not bear the data you need to exactly make any statistically sound statements.

They show a form of the sample distribution (however, I wonder here how can a variable that takes the value from 0 to 1 derived from the sample be plotted as a boxplot). Oh, these are not proportions, but rather counts?

Anyway, to make a reasonable conclusion you would need to get the standard errors of the proportions you gathered (let's say, of the true positive) and make a hypothesis test that this proportion resulting from method kNN is higher from the proportion got from glm. You could mnake a pairwise comparison between all three models, using t-test for the difference in proportions, for example.

Or you could use ANOVA to make a statement like 'this proportion is significantly different based on a method applied for unit classification'.

Clarify, please, when exactly you want to deliver after your study.

$\endgroup$
1
$\begingroup$

The techniques show quite similar results. Nevertheless, kNN might be a better choice for this specific example, because the box for false negative and false positive are slightly smaller than for the two other methods.

At least this is not wrong, but most of the truth lies in the careful phrasing. However, the statements are rather weak. The box plots themselves do not really deliver substantial evidence to make that statement solid. You would need to find a measure of the variance of the categorizations (which might be tedious) and then compare the classification performance on grounds of their reliability. E.g. if all variances would be small, you could argue that the one with the best mean is truly the best (whatever 'best' means in your case).

Can I use a smaller sample dataset to argue for a larger dataset? Both are except for their scope quite similar.

No. At least not if you have proof that the characteristics of both samples are the same. Otherwise you might be comparing artefacts of the method(s) you are using. My understanding is that you are trying to find a good/best method based on different data than the data where it actually counts.

If this is the central question, then it needs a lot more planning and thought. There are other considerations to take into account. When the actual analysis of the "real" data happens, you could just as well run several classification methods, and based on the training and validation results just pick the one that performs best on that data. Any measure could be used purity, efficiency, ROC area.

However, one thing is more or less completely excluded. Whatever method is used, you cannot train and validate it on "different" data than the data you are using for classification. There are some rather weak tests (like Kolmogorov-Smirnov), which usually only work on 1D data, so only projections of the feature space.

I didn't wanted to argue about the techniques behaviour based on a single train and test data combination. Therefore I've created onehundred randomly selected train and test datasets and showed their results in the boxplot above. Is this a valid idea?

Yes. In broader terms this is re-sampling, and depending on the way you would apply tests bootstrapping (e.g. look at wikipedia).

$\endgroup$

Your Answer

By clicking “Post Your Answer”, you agree to our terms of service and acknowledge you have read our privacy policy.

Not the answer you're looking for? Browse other questions tagged or ask your own question.