0
$\begingroup$

I am a novice in R, and fitting a linear model with lm(). Here is a summary of my linear model.
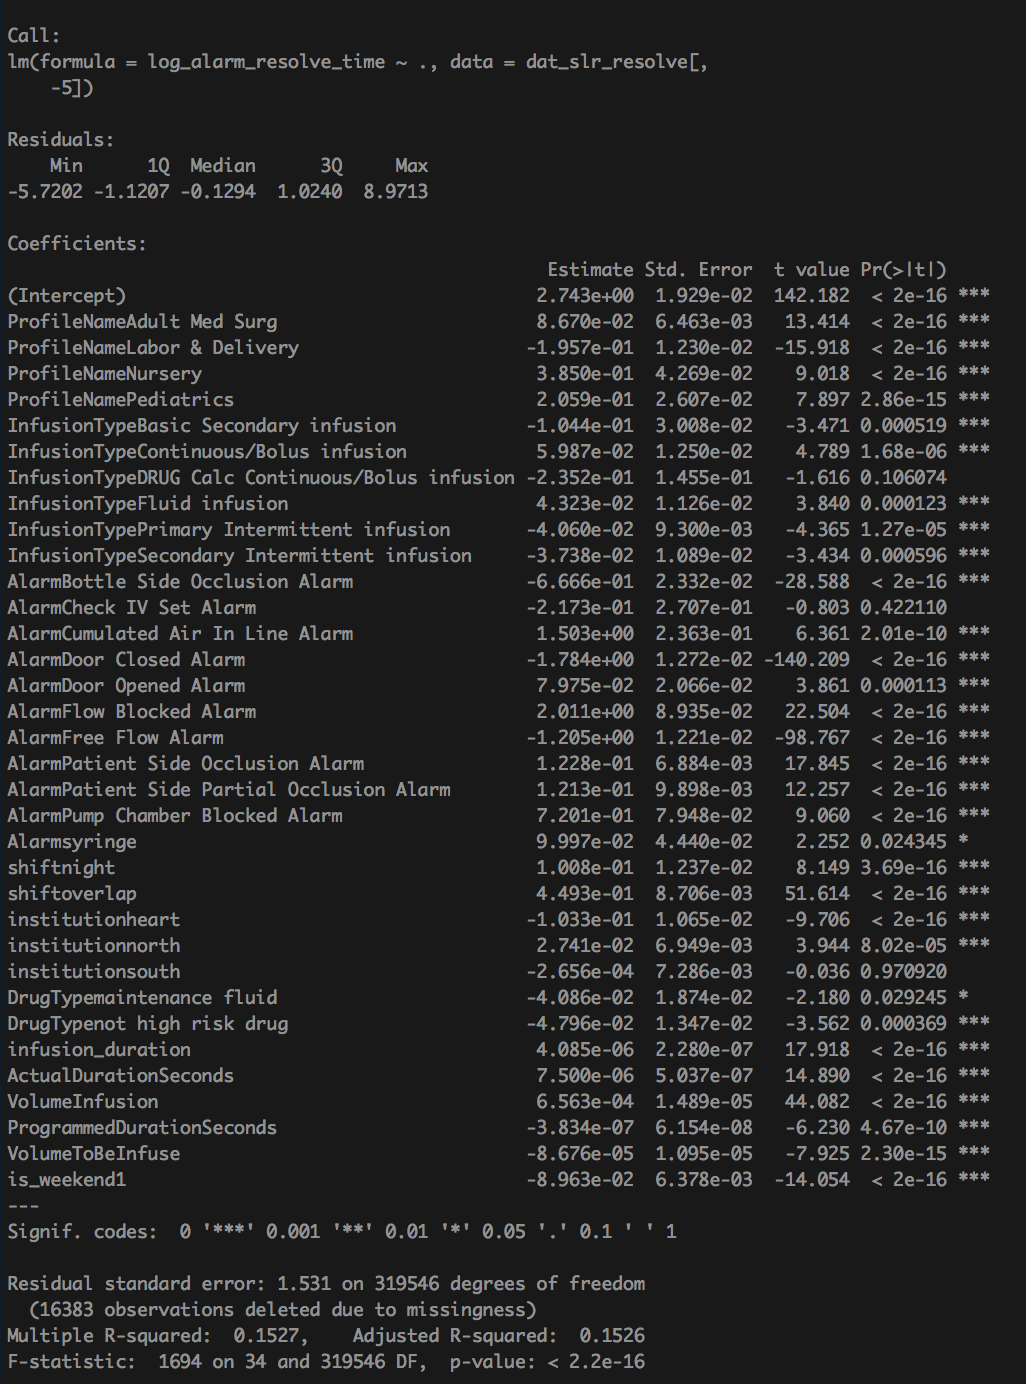
summary of model

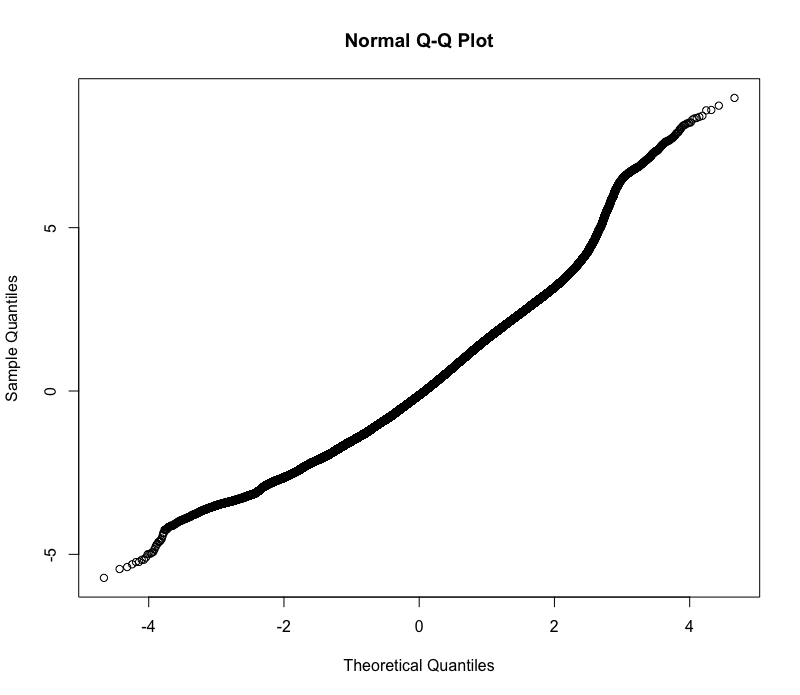
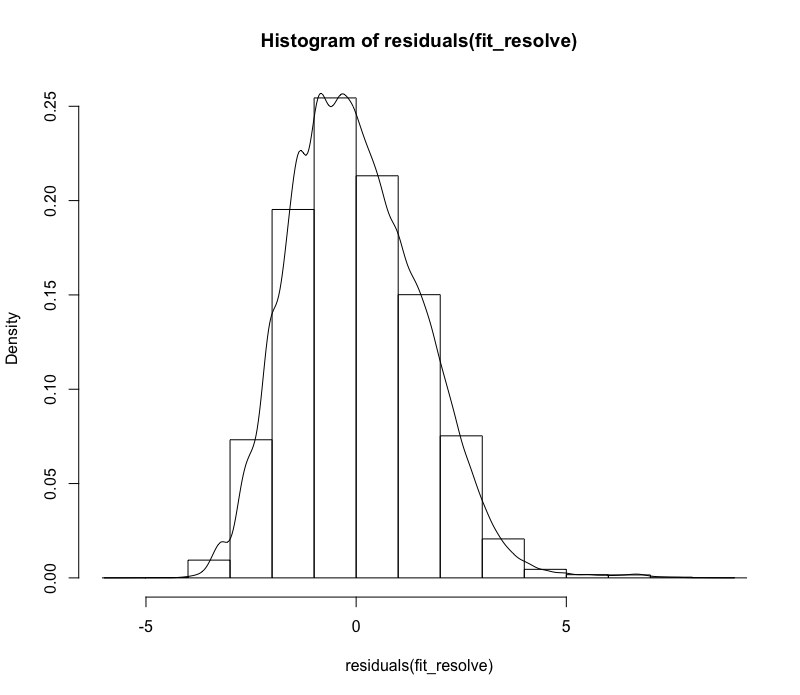
Here are some assumption checking plots
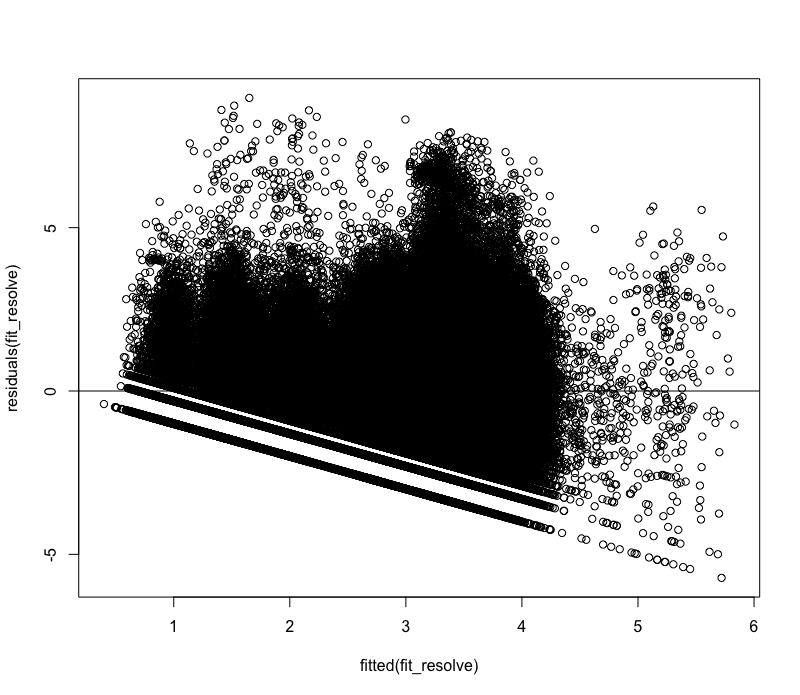
residual plot normal qqplot normal histogram

The normal histogram and qqplot looks okay to me, but there are strong patterns appearing in the residual plot. Anybody have a clue why that might be happening? I logged my dependent variable because it was highly skewed and most of my independent variables are categorical. I have got only a few continuous variables. Thanks for reading my post!

$\endgroup$
2
  • $\begingroup$ It would be helpful if you drew the line y=x on your q-q plot. I do not think that it looks OK. $\endgroup$
    – G5W
    Commented Mar 12, 2018 at 20:34
  • 1
    $\begingroup$ I believe this is answered at stats.stackexchange.com/questions/25068 (as well as in several other threads on residuals in regression): your response is discrete and bounded below. That is a strong indication that the model is inappropriate, because it does not account for this striking form of variation in the conditional distributions of the responses. $\endgroup$
    – whuber
    Commented Mar 12, 2018 at 21:49

0

Browse other questions tagged or ask your own question.