2
$\begingroup$

I have a set of data that looks like this:

Person 1 [48 total records]
2, 2, 2, 1, 2, 2, 1, 2, 1, 2, 1, 2, 2, 2, 1, 1, 1, 2, 1, 2, 2, 1, 2, 1, 1, 1, 1, 
   1, 1, 2, 2, 1, 2, 1, 1, 2, 2, 2, 2, 1, 1, 2, 2, 1, 2, 1, 1, 1,
--
Person 2 [56 total records]
1, 1, 2, 1, 1, 1, 1, 1, 1, 1, 1, 2, 1, 1, 1, 1, 1, 1, 1, 2, 2, 2, 1, 2, 1, 1, 1, 
   2, 1, 1, 1, 1, 1, 1, 1, 1, 1, 1, 1, 2, 1, 2, 2, 2, 2, 2, 2, 2, 1, 2, 1, 1, 1, 
   1, 2, 1,
--
Person 3 [18 total records]
1, 2, 1, 2, 1, 1, 1, 1, 2, 2, 1, 2, 2, 2, 1, 1, 1, 1,

A '1' indicates a false answer, and a '2' indicates a correct one. I want to be able to compare records to see if any people in the data set are performing significantly above or below average. I've heard of using z-scores and standard deviations, but I'm not sure if that's the correct approach, or even how I would go about doing the calculation.

I also need to find out the minimum number of records I would need in order to have sufficient confidence in the results (if that's the correct term). Basically, I want to make sure I'm only performing this analysis on people with enough records to minimize the role chance would play.

My math skills are pretty limited, so a simple explanation would be greatly appreciated.

$\endgroup$
2
  • $\begingroup$ You have different number of data points for each person, so it seems you are asking which people, if any, have percent correct scores higher or lower than would be expected by chance. If so, you might search this site using the term "outliers". If that is not what you are interested in, please explain your situation a bit more. $\endgroup$
    – Joel W.
    Commented Aug 17, 2012 at 1:23
  • $\begingroup$ I added an in depth answer that lays out the solution I came up with. I'm not sure if my solution is correct, but it should give you an idea of what I'm looking to accomplish. $\endgroup$
    – Jeremy
    Commented Aug 17, 2012 at 19:23

2 Answers 2

0
$\begingroup$

If what you are interested in simply whether or not a given individual is above or below the mean, z scores would do precisely that. This guide shows you how to do the calculations manually or many different software packages including Excel can do this as well. Following this you can compare their score to a z table (or again use software) to tell you the probability of observing that score by chance.

Note that you are assuming normally distributed data in this case. This assumption can be ignored, by the Central Limit Theorem if your sample size is large.

$\endgroup$
1
  • $\begingroup$ Thanks for the tip. I added an answer that details the solution I came up with, which was in a very similar vein to what you proposed. As far as normal distribution goes, I've got about 2,925 data points at the moment. Would that be considered a sufficiently large sample size in order to apply the Central Limit Theorem? $\endgroup$
    – Jeremy
    Commented Aug 17, 2012 at 19:26
0
$\begingroup$

This is the solution I came up with for this problem, based on some research and the answers so far. Sorry in advance for the length. I wanted to provide an in-depth explanation of my approach so I can be sure I didn't miss anything important.

I'll start with a little more detail about my specific situation. I've got a database that contains records of jobs, clients, and workers. My goal is to see if a given worker has a lower than average score when it comes to converting first-time jobs into recurring jobs.

I do this by taking all first-time jobs that a given worker has been assigned to, and I then check to see if any subsequent jobs exist for the same client. If there were subsequent jobs the worker gets a 1, otherwise they get a 0. This gives me something that looks like this:

Worker 1 [48 total records (first-time jobs)]
0, 0, 0, 1, 0, 0, 1, 0, 1, 0, 1, 0, 0, 0, 1, 1, 1, 0, 1, 0, 0, 1, 0, 1, 1, 1, 1, 1, 1, 0, 0, 1, 0, 1, 1, 0, 0, 0, 0, 1, 1, 0, 0, 1, 0, 1, 1, 1,
--
Worker 2 [56 total records (first-time jobs)]
1, 1, 0, 1, 1, 1, 1, 1, 1, 1, 1, 0, 1, 1, 1, 1, 1, 1, 1, 0, 0, 0, 1, 0, 1, 1, 1, 0, 1, 1, 1, 1, 1, 1, 1, 1, 1, 1, 1, 0, 1, 0, 0, 0, 0, 0, 0, 0, 1, 0, 1, 1, 1, 1, 0, 1,

I then take this data and calculate the mean. I do this by counting the total number of first-time jobs in my system (2,925), as well as the sum of the 1's and 0's. This gives me a mean of 0.38 (so 38% of all first-time jobs typically become recurring jobs). I then calculate the standard deviation, which in this case is 0.13.

I then look at each worker who has completed a minimum of 30 first-time jobs. This is so that I only analyze workers with a sufficiently large sample size, in order to increase confidence in the results.

I then come up with a mean score for each of these workers (the sum of the 1's and 0's, divided by the total number of first-time jobs). Finally, I convert this into a z score, which I do by subtracting the mean (for all the data) from the worker's mean score. I then divide the result by the standard deviation to obtain the individual z score. Finally, I put the results in a bar chart, which looks like this:
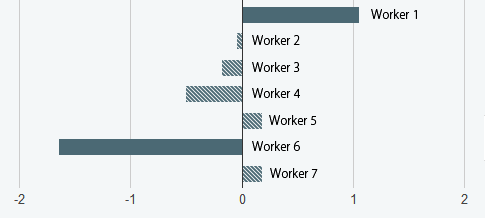
Bar chart demo

The dark bars are for any result with a z-score above 1 or below -1.

That's pretty much it. I guess my questions are as follows:

  1. Is this the correct approach, given my goals?
  2. Does it make sense to limit this analysis to workers with a minimum of 30 records? I know that generally the larger sample size the better, but would it work to apply this analysis to workers with only 20 records, for example?
  3. Finally, what z-scores should I consider significant? Right now I am focusing on anything greater than 1, but is that too low?

I greatly appreciate any input. Thank you.

$\endgroup$
11
  • $\begingroup$ It sounds to me that this is merely an update to your question (updates are always welcome), so it should be appended to the original post and not posted as a new answer. Moderators can convert it for you, or you can just copy/paste the above to your question and delete this reply. $\endgroup$
    – chl
    Commented Aug 17, 2012 at 20:55
  • $\begingroup$ Well, I do have this deployed as an actual solution, and will accept the answer if there are no major issues raised with my approach. $\endgroup$
    – Jeremy
    Commented Aug 17, 2012 at 21:16
  • $\begingroup$ Fair enough. But, you raise three questions at the end of your reply, and I'm afraid comments provide too little space for serious discussion. $\endgroup$
    – chl
    Commented Aug 17, 2012 at 21:19
  • $\begingroup$ I suppose someone could respond to my questions using the standard answer format, if comments were insufficient. If so I could move the questions to the original post. Would that work? $\endgroup$
    – Jeremy
    Commented Aug 17, 2012 at 21:22
  • $\begingroup$ Sure. As I said, you can edit your question, or we can convert this reply as an edit for you. $\endgroup$
    – chl
    Commented Aug 17, 2012 at 21:24

Your Answer

By clicking “Post Your Answer”, you agree to our terms of service and acknowledge you have read our privacy policy.

Not the answer you're looking for? Browse other questions tagged or ask your own question.