This is the solution I came up with for this problem, based on some research and the answers so far. Sorry in advance for the length. I wanted to provide an in-depth explanation of my approach so I can be sure I didn't miss anything important.
I'll start with a little more detail about my specific situation. I've got a database that contains records of jobs, clients, and workers. My goal is to see if a given worker has a lower than average score when it comes to converting first-time jobs into recurring jobs.
I do this by taking all first-time jobs that a given worker has been assigned to, and I then check to see if any subsequent jobs exist for the same client. If there were subsequent jobs the worker gets a 1, otherwise they get a 0. This gives me something that looks like this:
Worker 1 [48 total records (first-time jobs)]
0, 0, 0, 1, 0, 0, 1, 0, 1, 0, 1, 0, 0, 0, 1, 1, 1, 0, 1, 0, 0, 1, 0, 1, 1, 1, 1, 1, 1, 0, 0, 1, 0, 1, 1, 0, 0, 0, 0, 1, 1, 0, 0, 1, 0, 1, 1, 1,
--
Worker 2 [56 total records (first-time jobs)]
1, 1, 0, 1, 1, 1, 1, 1, 1, 1, 1, 0, 1, 1, 1, 1, 1, 1, 1, 0, 0, 0, 1, 0, 1, 1, 1, 0, 1, 1, 1, 1, 1, 1, 1, 1, 1, 1, 1, 0, 1, 0, 0, 0, 0, 0, 0, 0, 1, 0, 1, 1, 1, 1, 0, 1,
I then take this data and calculate the mean. I do this by counting the total number of first-time jobs in my system (2,925), as well as the sum of the 1's and 0's. This gives me a mean of 0.38 (so 38% of all first-time jobs typically become recurring jobs). I then calculate the standard deviation, which in this case is 0.13.
I then look at each worker who has completed a minimum of 30 first-time jobs. This is so that I only analyze workers with a sufficiently large sample size, in order to increase confidence in the results.
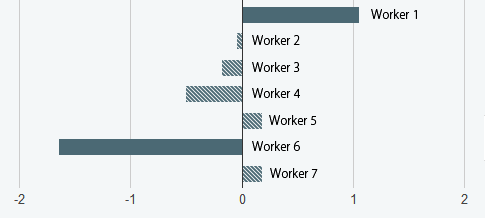
I then come up with a mean score for each of these workers (the sum of the 1's and 0's, divided by the total number of first-time jobs). Finally, I convert this into a z score, which I do by subtracting the mean (for all the data) from the worker's mean score. I then divide the result by the standard deviation to obtain the individual z score. Finally, I put the results in a bar chart, which looks like this:

The dark bars are for any result with a z-score above 1 or below -1.
That's pretty much it. I guess my questions are as follows:
- Is this the correct approach, given my goals?
- Does it make sense to limit this analysis to workers with a minimum of 30 records? I know that generally the larger sample size the better, but would it work to apply this analysis to workers with only 20 records, for example?
- Finally, what z-scores should I consider significant? Right now I am focusing on anything greater than 1, but is that too low?
I greatly appreciate any input. Thank you.

