I have 10 predictor variables and one outcome variable. However, I used three scales to measure the outcome variable. I conducted three separate regression analysis, with one of the three different scales as outcome variable, and the 10 predictors as predictor variables. Now, the pattern of significance is not the same across the three regression analysis. Thus, I want to somehow integrate the results by conducting meta analysis. Any ideas how to do that?
3 Answers
Meta-analysis of regression slopes is less common but not unheard of (for methodological details, see Aloe & Becker, 2012; Peterson & Brown, 2005). The typical concern with this approach is that it's often improbable (if not impossible) to ensure model equivalency about samples--the meaning of a slope will change if different combinations of variables are included/excluded across the samples. Thus, while the computation is relatively straightforward, the meaning-making is often precarious. But as @Joe_74 correctly indicates, it doesn't make a whole lot of sense to meta-analyze estimates all coming from the same sample.
Instead, I see your question as a good case where a structural equation modelling approach could be quite useful (see this thread if you are new to SEM and want an accessible introduction). I could see at least three fruitful ways of attempting to address your question; I'm going to simplify it to an example of where you only have one predictor (instead of 10), just to make the visualizations more straightforward, but the approach could be extended to 10 predictors with a bit more coding.
Approach 1: Path Analysis of Observed Standardized Variables
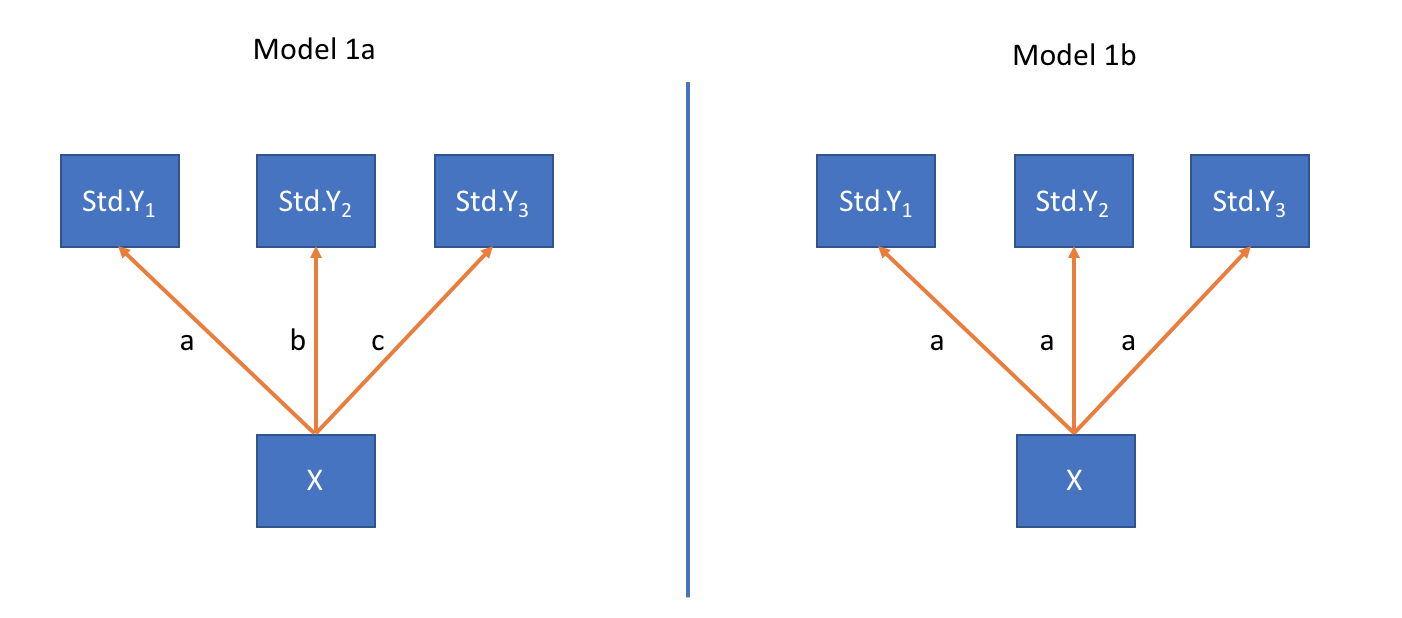
If taking advantage of the latent variable modelling capacities of SEM seemed too daunting, initially, you could keep your analysis at the level of observed variables, in which you would predict your three scales by your chosen variable(s). The main issue here is that you can't compare the slopes across outcomes yet, because your outcomes might be scaled differently. Standardizing your outcome scores pre-analysis should do the trick, and then you could compare the fit of a model where the slopes are freely estimated across outcomes (Model 1a on the left [note the unique parameter labels]) against one in which they have been constrained to equality (Model 1b on the right [note the identical parameter labels]).
Approach 2: SEM of One Common Outcome Factor
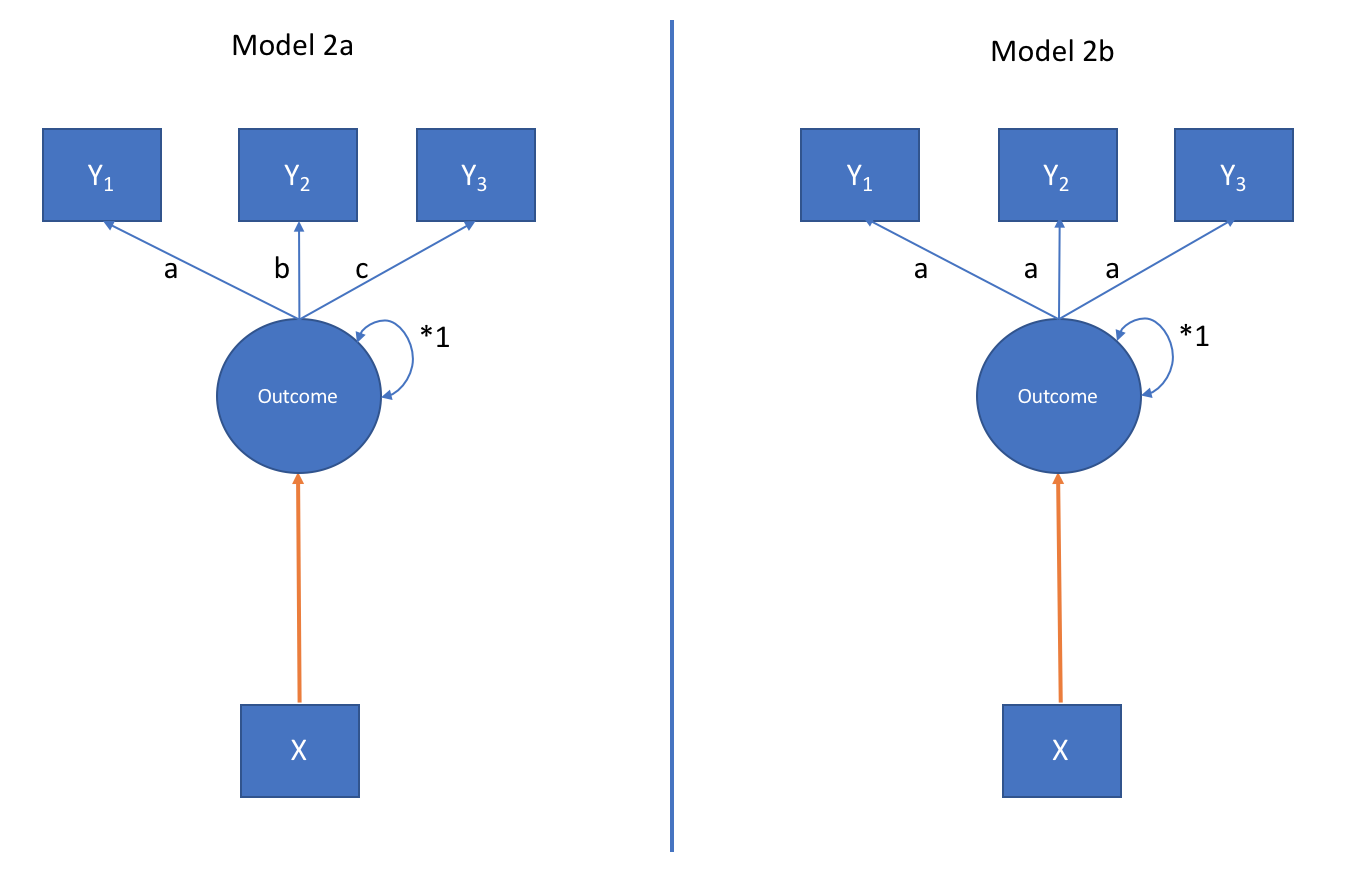
By the sounds of it, your three scales represent three different ways of measuring the same underlying "thing". If so, you could specify each scale score as loading onto a common factor, and then predict that common factor by your chosen variable(s). Now, since you only have one predictor and one outcome, there are no structural pathways to constrain (and compare). But if you were interested in tackling the question of whether each scale is an equally strong indicator of the underlying construct, you could compare the fit of a model where the three factor loadings are unconstrained model (Model 2a on the right) to one where they are constrained to equality (Model 2b on the left).
Approach 3: SEM of 3 Common Factors
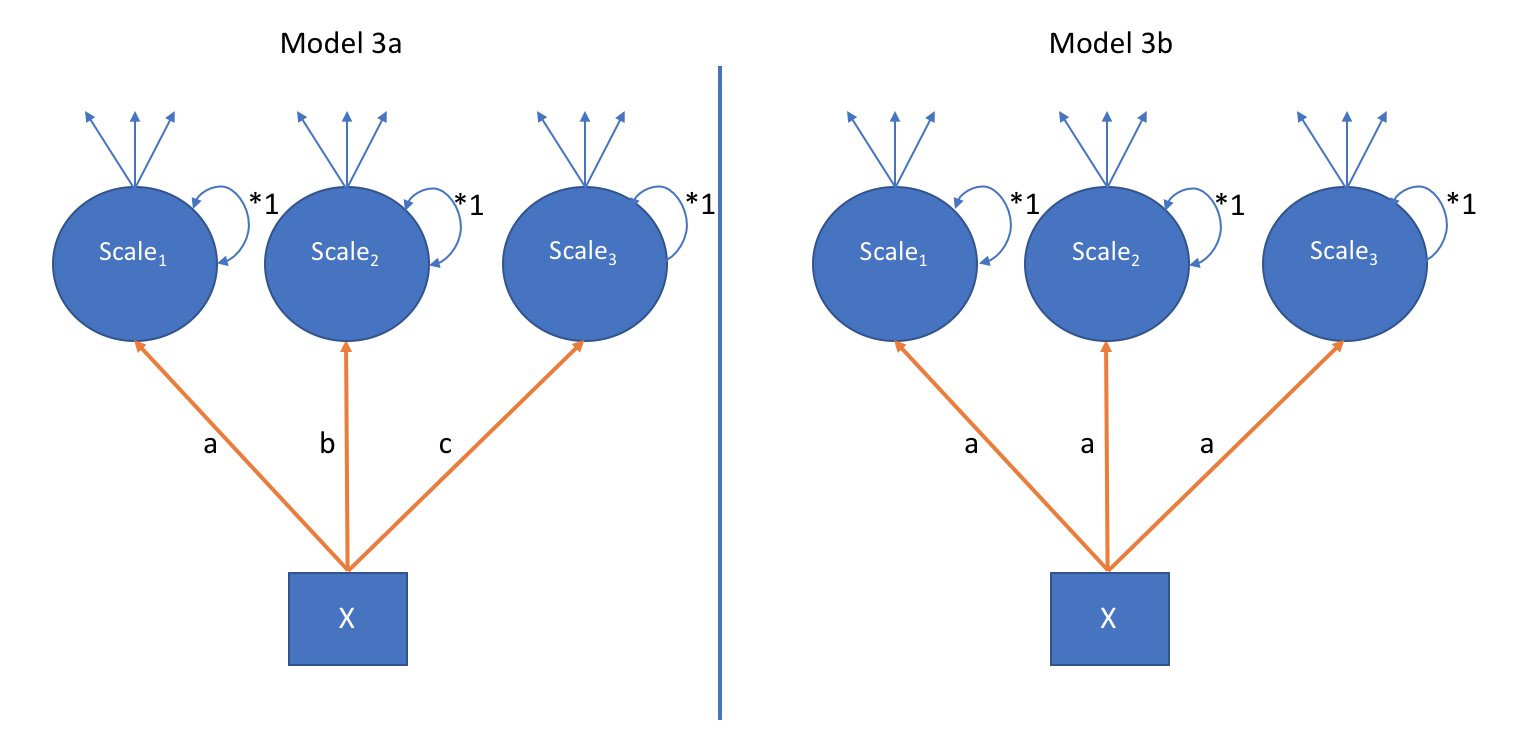
Finally, if you don't see your three scales as tapping into the same underlying construct, you could adopt a hybridized approach of 1. and 2., and predict the scales separately, but model them as latent constructs, once again comparing unconstrained (Model 3a) and constrained models (Model 3b). Using a fixed-factor (i.e., standardized latent factor) scale-setting approach would help to ensure that your slopes have a similar scaling/meaning. You could also estimate the correlations between the factors (not shown because it would make the figure a bit messy).
References
Aloe, A. M., & Becker, B. J. (2012). An effect size for regression predictors in meta-analysis. Journal of Educational and Behavioral Statistics, 37(2), 278-297.
Peterson, R. A., & Brown, S. P. (2005). On the use of beta coefficients in meta-analysis. Journal of Applied Psychology, 90(1), 175-181.
- Vaitsiakhovich, T., Drichel, D., Herold, C., Lacour, A., & Becker, T. (2015). METAINTER: meta-analysis of multiple regression models in genome-wide association studies. Bioinformatics, 31(2), 151-157.
This paper provides an introduction to software to carry out meta-analysis of regression models. It's made for bioinformatics/genomics where people cannot do a full OLS model fit because there are often >100k or >1M predictors (SNPs) and many fewer cases (persons) in the study. In this case, what researchers do is carry out a lot of small regressions, 1 SNP at a time along with controls if desired (e.g. age, sex, ancestry from principal components analysis) and then combine that in a meta-analysis, which they then call a genome-wide association study (GWAS). They could also just do penalized regression with the full dataset, but this is usually not possible because researchers are not legally allowed to share the case-level data with each other, hence the need to do meta-analysis on the summary statistics from regression models (this paper however developed a method (lassosum) to use the lasso (L1 penalization) on summary statistics with ~90% efficiency of case-level data).
If, on the other hand, you have a situation with a single dataset with too many variables and many models, you might instead want to run a ton of different models on that one dataset and then meta-analyze those. In this case, in economics, they use something called Bayesian Model Averaging (BMA) also called Bayesian Averaging of Classical Estimates (BACE) that allows some analyses of this situation. The classic paper on this is Sala-i-Martin et al 2004 who used it for modeling economic growth between countries where there are too many variables to model jointly.
If I understood right, there are 3 regression models (of the same study) and you wish to use the results in a meta-analysis.
To start, if we consider we have, say, 3 "studies", I gather at least 4 studies would be necessary to get minimally reasonable results in a meta-analysis. That being said, if the results differ according to the scale of the outcome, I think this is not a "meta-analytical" issue.
Instead, we should demonstrate the results are robust enough, and a sensitivity analysis seems to me the most sound strategy. As a matter of fact, there are no studies in this situation, but a single study with a subtle twist in the generation of the outcome variable.
The difference in results on account of the differences in the outcome variable prompts us to reflect about the strategies used to create such scales. By the way, they are not unveiled in the query and the core issue (as well as model's interpretation) may well be linked to the creation of the different scales.


