13
$\begingroup$

I'm new to the forum and posting my first of many questions. I'm working on a Linear Regression model and the $R^2$ is 0.89 which tells me my regression line is a good fit. When I calculated the residual sum squared, the number is around 4060, which is telling me the difference between the predicted and actual values are large.

Do the values $R^2$ = 0.89 and RSS = 4060 contradict each other?

$\endgroup$

1 Answer 1

17
$\begingroup$

No, these numbers do not contradict each other. It sounds like you have an understanding of what $R^2$ means: it represents the proportion of the variance in your data which is explained by your model; the closer to one, the better the fit.

The residual sum of squares (RSS) is the sum of the squared distances between your actual versus your predicted values:

$RSS = \sum\limits_{i=1}^{n}(y_i-\hat y_i)^2$

Where $y_i$ is a given datapoint and $\hat y_i$ is your fitted value for $y_i$.

The actual number you get depends largely on the scale of your response variable. Taken alone, the RSS isn't so informative.

Example:

Picture your residuals as a vertical line connecting your actual values to your predicted value (red traces in the plot below). You can imagine that if your y-axis is on a different scale, the number you get will be very different.

For instance, consider that your y-axis were kilometers, and a given point is about 0.5km away from your line of best fit. Then, the residual on that given datapoint is 0.5. However, if your scale is meters, then that same datapoint has a residual of 500. Your RSS will be much larger, but the fit does not change at all; in fact the data don't change at all either. But the RSS changes drastically.
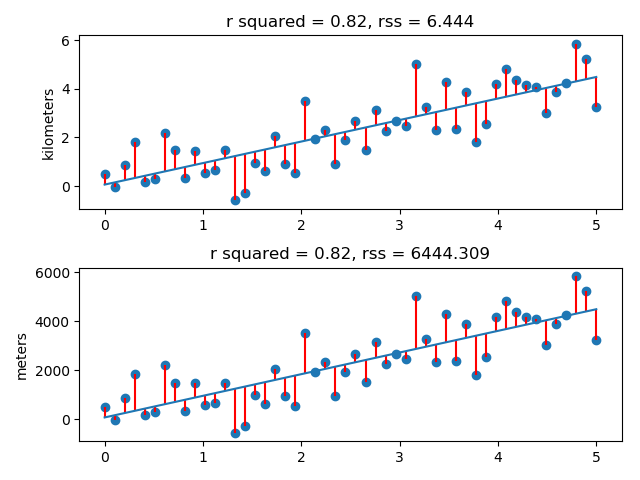
RSS changes with scale

$\endgroup$
3
  • $\begingroup$ Excellent!, thank you so much for explaining how RSS can be affected by the y scale. I really appreciate you taking the time to provide a thorough explanation. I have 1 follow up question, what other item do you personally look at besides the R2 to determine if your regression line it the best fit? $\endgroup$
    – JJ Y
    Commented May 31, 2018 at 21:39
  • $\begingroup$ $R^2$ is a good metric for linear regression. Take a look at this answer for more details $\endgroup$
    – sacuL
    Commented May 31, 2018 at 21:48
  • $\begingroup$ I don't want to be 'that guy', but linear regression is a bad choice when the data is not I(0). I know that it's easier to display deviations around a trend, but it gets people used to seeing bad practice. Gauss-Markov, anyone? $\endgroup$
    – GT.
    Commented Jan 20, 2020 at 1:39

Your Answer

By clicking “Post Your Answer”, you agree to our terms of service and acknowledge you have read our privacy policy.

Not the answer you're looking for? Browse other questions tagged or ask your own question.