7
$\begingroup$

I have a known set of data. I have created a "linear best fit line" for that set of data. Is there a way to determine how well my set of data fit that best fit line (some sort of score)?

I'm very novice within stats, but basically I want to know if my line represents those datapoints that I know.

$\endgroup$
5
  • $\begingroup$ Are you familiar with $R^2$? $\endgroup$
    – Sycorax
    Commented Nov 13, 2014 at 20:11
  • $\begingroup$ I've heard of it but I'm not sure if I can use it on a dataset where the y axis has little variation, won't the value be close to zero in that case? $\endgroup$
    – Josef
    Commented Nov 13, 2014 at 20:33
  • 4
    $\begingroup$ $R^2$ tells you very little (in general) about linearity of the fit--nor do the methods mentioned in the answer you accepted (as indicated in a comment below that answer, which leads me to hope it might soon be improved). You would be better off waiting for good solutions that are well supported and reasoned. $\endgroup$
    – whuber
    Commented Nov 13, 2014 at 21:26
  • $\begingroup$ To help you understand @whuber's comment about $R^2$, it may help you to read his answer here: Is $R^2$ useful or dangerous? $\endgroup$ Commented Nov 13, 2014 at 22:23
  • 1
    $\begingroup$ Short answer: statistics like $R^2$ are good, but you still need to think before you make a judgement. See e.g. Anscombe's quartet. $\endgroup$
    – geometrian
    Commented Nov 14, 2014 at 2:31

2 Answers 2

6
$\begingroup$

I want to know if my line represents those datapoints

The problem with such an idea is there are many ways that a fitted model might be unrepresentative of the data. As a result, a single measure won't really capture the ways in which a model can fail to be representative.

This is why regression diagnostics consist not of a single number, but of multiple displays - some of which might reveal any of several different problems with the model.

Taking you to be asking about simple regression (single-x), here's a couple of examples of things you might consider as "not representative":

  1. The underlying relationship you're attempting to model with $E(y|x)=\beta_0+\beta_1 x$ might be non linear. Some form of lack of fit measure can sometimes be useful - this is easy if you have replicates, but if not, with some additional assumptions (such as local smoothness if it's not linear) can allow us to get some measurement of that (lowess, for example, or some form of regression spline can be useful for picking up such changes, and a measure of unrepresenativeness would relate to the improvement given by such a nonlinear model). The more common approach, however, is to examine residuals (where, again, tools like lowess may often be used).

  2. The model for the mean $E(y|x)=\beta_0+\beta_1 x$ might be correct, but the mean may itself be quite unrepresentative of the data (in that much of the data are not behaving like the mean - i.e. the mean may not be a useful descriptor of the conditional distribution):
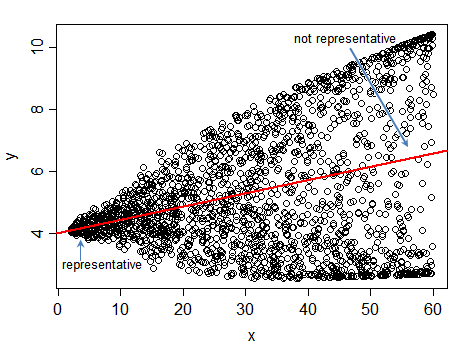
    enter image description here

    Here we have a complex situation --

    • for small $x$ the conditional distribution of the data is unimodal and the line is representative of the relationship between $y$ and $x$ (e.g. near the left end of the data, the mean, median and mode are all linear in $x$), but

    • for large $x$, the distribution about the line is strongly bimodal, and as such, the line representing $E(y|x)$ - while correctly describing the conditional mean - doesn't represent the data; indeed in that region the relationship of the two modes with the mean are each nonlinear, even though the mean is linear throughout.

There are additional issues besides the form of the mean that you may want to consider. For example, if the variance is far from constant, the usual regression line may be inefficiently estimated, and the usual inference won't work as expected. Additionally, if the aim is to describe the way that $y$ is related to $x$, describing the spread may be just as important as describing the mean.

--

You can construct measures of various aspects of representativeness, but because 'representativeness' is multifaceted, a single measure won't meaningfully capture all those aspects. Indeed, as we see in the example, how representative a line is might be different in different parts of the data. A single number would obscure such subtleties.

[In particular situations, of course, you may be able to discount/disregard many of the possible ways for the line to be unrepresentative, and hence say "I'm mostly interested in one particular aspect" - such as nonlinearity - and then design some measure of that. That may be just fine in situations in which you can do that, especially if automation is needed.]

$\endgroup$
6
$\begingroup$

There are a several ways you could do this. First recall that the linear best fit line is the line which minimizes the sum of squared residuals (see least squares): $$\sum_{i=1}^{n}{r_i^2}$$ where $r_i$ is the residual for data point $i$, and $n$ is the number of data points. A residual is the distance between a point in your data and a point on your line.

With this in mind, here's a few ideas of how to "score" how well your line fits the data:

  • Calculate the max absolute distance between your data and the line. This would tell you if you have any data points that are really far away. $$\max_i{|r_1|}$$

  • Calculate the average distance between your data and the line (average of L1 norm of your residuals, also known as S). This would tell you how far away most of your data points are. $$\frac{\sum_{i=1}^{n}{|r_i|}}{n}$$

  • Calculate the coefficient of determination, $R^2$: $$ R^2 = 1 - \frac{\sum_{i=1}^{n}{r_i^2}}{\sum_{i=1}^{n}{(y_i - \bar{y})^{2}}} $$ where $y_i$ represents the value of each of your data points, and $\bar{y}$ is the mean of your data.

Given your comment that your goal is to determine if a dataset is linear, consider this:

Approximately 95% of the observations should fall within $\pm$ 2*standard error of the regression from the regression line

(see "How to Interpret S, the Standard Error of the Regression")

Therefore, if 95% of your data points are within $2 * S$ of your linear best fit line, then you can be confident your data is linear (where $S$ is what I called the average distance).

More information: Linear or Nonlinear Regression?

Furthermore, you also mentioned predicting future values as accurately as possible, in this case you could split your data into two parts: a training set, and a test set. Then:

  1. Fit a line to the training set only (leave out the test set)
  2. Evaluate whether the line accurately predicts the test set. (i.e. you are testing the model)

If you can accurately predict the test set, then you've successfully modeled your data, in this case with a linear function. This is the basis of machine learning, which is a large topic so I won't expand on it more here.

$\endgroup$
5
  • $\begingroup$ I was thinking something similar but I didn't know if it was the conventional way to do it, but I will try those two that you mentioned. I was thinking of using a pearson coefficient to determine whether my data was perfectly linear, but since some of my datasets basically don't change depending on x (straight line on y axis), I couldn't really use it (I know it's used to see correlation between variables), so I figured I would somehow determine if data was linear by calculating a best fit line for it and then determine whether data was far from data line? Any other suggestion or am I crazy? $\endgroup$
    – Josef
    Commented Nov 13, 2014 at 20:28
  • 1
    $\begingroup$ Ah, checking whether your data is linear is actually a slightly different question that what you posted. What I would do is fit several polynomials of varying degrees and see which one fits the best, and by how much. For example, if a degree 2 polynomial has roughly the same "score" as your best fit line then your data might be linear, but if the degree 2 line is substantially better, then it clearly isn't linear. Have a look at this graph to see what I mean by "varying degrees". $\endgroup$
    – MD004
    Commented Nov 13, 2014 at 20:40
  • $\begingroup$ I guess I want to know if my best fit line is a good representation of my current data, my assumption was that if it is, then my data is likely linear (since my line is linear) and that I would be able to use that line to predict future values (hopefully as correctly as possible). $\endgroup$
    – Josef
    Commented Nov 13, 2014 at 20:49
  • $\begingroup$ I have revised my answer $\endgroup$
    – MD004
    Commented Nov 13, 2014 at 22:17
  • 2
    $\begingroup$ Whether 95% of the residuals are w/i 2 SDs mixes linearity & normality. You might consider a runs test of the residuals. $\endgroup$ Commented Nov 13, 2014 at 22:21

Your Answer

By clicking “Post Your Answer”, you agree to our terms of service and acknowledge you have read our privacy policy.

Not the answer you're looking for? Browse other questions tagged or ask your own question.