8
$\begingroup$

If possible could you please let me know if I am on the right track? I don't know anyone who works with GAMs who I can ask and I would be so appreciative of any help I receive. I use mgcv in R.

My data is daily flower counts ('Total'), with different plant genetic lines ('RIL') and 4 different treatments ('Trt'). I basically want to compare the 4 treatments and see if there is a difference in flower production over time between them. Are the shapes of the flowering curves different?

An example of my gam:

gam1 <- gam(Total ~ Trt * RIL + s(DateNum, k = 9, bs = "fs") + s(Plant, bs = "re"), data=ce1230)

I understand that using anova.gam(gam1) I can see if there is a significant difference between treatments and rils. However when I plot gam1, it shows one curve that represents everything. I was hoping to see a plot with separate curves for each of my 4 treatments. Does this mean that I need to make gamtrt1, gamtrt2, gamtrt3, gamtrt4 and somehow compare the separate gams to each other? or use the original anova(gam1) and just plot each treatment separately? Or am I looking at this the entirely wrong way?

$\endgroup$
7
  • $\begingroup$ What is "Plant"? The reason I ask is that it sounds categorical, in which case a smooth term for it may not be appropriate. $\endgroup$
    – jbowman
    Commented Jul 14, 2018 at 1:28
  • $\begingroup$ I had 840 plants in my experiment, so the term Plant was supposed to be for any random effect due to individual plant differences in flower output. $\endgroup$
    – Abbey
    Commented Jul 14, 2018 at 2:15
  • 1
    $\begingroup$ As you have it structured, the treatment only affects the intercept, not the slope over time. In order to get an interaction between the Trt and the DateNum smooth, which is what I suspect you want, I believe you have to add by=Trt to the interior of the s(DateNum,... smooth term and you will also need to have Trt as a factor term independent of RIL, i.e., Total ~ Trt + Trt*RIL + s(DateNum, by=Trt, k=9, bs="fs") + .... $\endgroup$
    – jbowman
    Commented Jul 14, 2018 at 2:22
  • 1
    $\begingroup$ Assuming you want to smooth on RIL and make separate smooths, see the help on "Specifying generalized additive models"; ?gam.models, particularly the section on by and the corresponding example. $\endgroup$ Commented Jul 14, 2018 at 2:45
  • 1
    $\begingroup$ @jbowman: the bs="re" makes it a random effect. $\endgroup$ Commented Jul 14, 2018 at 4:11

3 Answers 3

2
$\begingroup$

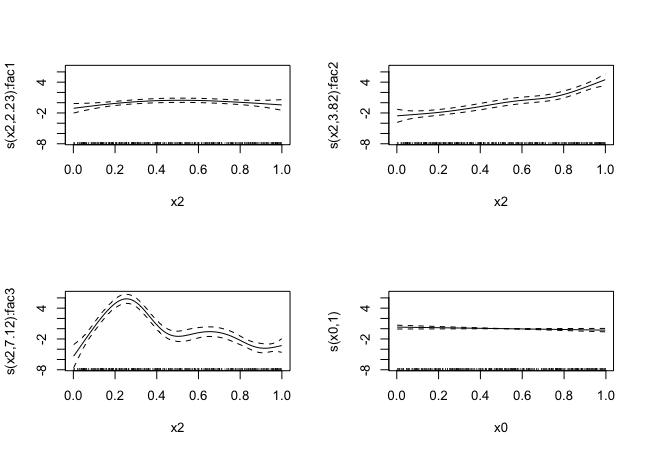
I'd guess you want the by parameter for s. The resulting set of plots then has one for each level of the by factor. In this example from ?gam.models, there are three levels of fac, so there are three plots for x2 and one for x0.

dat <- gamSim(4)
b <- gam(y ~ fac + s(x2, by=fac) + s(x0), data=dat)
plot(b, pages=1)

enter image description here

$\endgroup$
4
  • $\begingroup$ Thank you! This is exactly what i was looking for- Adding by=Trt in the s(DateNum) term gave me a plot for each treatment. Here are my graphs: ibb.co/iWvZMy - Hopefully the link works! Do you have any insight as to why the GAM fitting my data would make my flower counts (y-axis) become negative? Obviously a plant cannot have -10 flowers. Is there a way to tell the GAM to not be negative? Sorry if these questions sound silly. $\endgroup$
    – Abbey
    Commented Jul 16, 2018 at 22:06
  • $\begingroup$ I used this plot_smooth(gam1, view="DateNum", plot_all="Trt", rm.ranef=TRUE) from itsadug, and it gave me this graph: ibb.co/bP6r1y, which is pretty and allows me to see both treatments on the same graph, but the peak of the graph is different. And it still becomes negative. But it looks more like my data. $\endgroup$
    – Abbey
    Commented Jul 16, 2018 at 22:09
  • $\begingroup$ I suppose this might be okay, if I just don't graph the negative portions? ibb.co/nKKNPJ $\endgroup$
    – Abbey
    Commented Jul 16, 2018 at 22:23
  • $\begingroup$ If negative values are impossible, then your model should reflect that. Don't just hide the parts that don't work for you! A Poisson model (as @AnonymousEmu mentioned) would be worth investigating, or at least log-transforming the response. $\endgroup$ Commented Jul 17, 2018 at 16:58
1
$\begingroup$

I would first try an ANOVA and look at that F-test. If it rejects that, there is evidence that there is variation between treatments. After that, since your outcome if count data, I would do a poisson regression. Unlike GAMs where it can be hard to test the important of effects, Poisson regression gives you your usually p-values which makes it simple to see which things are important to causing the differences in your data.

https://stats.idre.ucla.edu/r/dae/poisson-regression/

If there is significnet difference between your mean and variance, (poisson says that they should be the same), modify the poisson regression with a Poisson-Gamma model.

$\endgroup$
7
  • $\begingroup$ I'm confused... why would switching to a Poisson regression be appropriate? The point of the GAM is to deal with non-linearity, not count data or non-constant variance. $\endgroup$ Commented Jul 14, 2018 at 2:33
  • $\begingroup$ I didn't read the question fully -- I see now they are counts! Of course a Poisson regression would be worth investigating. $\endgroup$ Commented Jul 17, 2018 at 16:55
  • $\begingroup$ I'm not sure if a Poisson regression would work as one of the assumptions is that the data needs to have independence of observations, and because I am counting flower production on the same plants each day, flower production on day 3 is not independent of day 2, etc. @Aaron do you still think that this is appropriate? $\endgroup$
    – Abbey
    Commented Jul 23, 2018 at 21:18
  • $\begingroup$ Just to be sure, could you be explicit in what ways they would not be independent? $\endgroup$ Commented Jul 23, 2018 at 21:56
  • $\begingroup$ The number of flowers produced by a plant each day depend on # of flowers the days before due to use of resources by the plant. Flower production in the plant I am studying typically follows a pattern - increase flower production each day until the plant hits peak flower production, then afterwards flower production declines each day as resources are also now being used to mature seeds. Ex: flower counts on plant#10 over 13 days might be 1, 4, 10, 16, 25, 39, 44, 33, 31, 25, 10, 5, 0, (plus perhaps some unpredictable flowering at the end due to treatment effects). And I have 840 plants total. $\endgroup$
    – Abbey
    Commented Jul 24, 2018 at 0:55
1
$\begingroup$

You have some problems with your data; you can't have a random effect of Plant as a factor and get the plot you showed in the link in comment to @Aaron's Answer. Are you sure that Plant is a factor with more than 1 level? If not, you need to code your data correctly to get a random intercept per plant. Also, can you include both RIL and Plant level effects? Once you've accounted for the separate Plant effects (intercepts), won't that also logically account for the genetic line effects also?

Second, if you are using bs = 'fs', you need to pass in a continuous variable and a factor; so far you only pass in DateNum. At the moment you have

s(DateNum, k = 9, bs = "fs")

and I think you wanted

s(DateNum, Trt, k = 9, bs = "fs")

This model is similar to the one proposed by @Aaron, but is somewhat different in detail. The full model might be

gam(Total ~ Trt * RIL + s(DateNum, Trt, k = 9, bs = "fs") + s(Plant, bs = "re"),
    data=ce1230)

but I suspect even that is wrong? (For fs smooths you don't need the parametric Trt.) So I think,

gam(Total ~ RIL + Trt:RIL + s(DateNum, Trt, k = 9, bs = "fs") + 
    s(Plant, bs = "re"), data=ce1230)

Where the main effect of Trt is actually contained in the fs smooth, so we don't specify it parametrically.

The main difference between this model and @Aaron's in that here, there is a single smoothness parameter for the smooths of DateNum by Trt, whereas in @Aaron's answer each of the smooths gets it's own smoothness parameter. This boils down to a choice between whether you expect similar wiggliness (the shapes of the smooths can be different) for each smooth or whether you expect some of the four smooths to be a lot wigglier than others?

What you seem to want is interactions between RIL and Trt plus separate smooths for each Trt. But do you want separate smooths for each RIL and Trt combination? That would require a separate variable formed by the combinations of RIL and Trt available in your data:

ce1230 <- transform(ce1230, 
                    RILTrt = interaction(RIL, Trt, drop = TRUE))

And then you could fit

gam(Total ~ s(DateNum, RILTrt, k = 9, bs = "fs") + 
    s(Plant, bs = "re"), data=ce1230)

or

gam(Total ~ s(DateNum, k = 9, by = RILTrt) + 
    s(Plant, bs = "re"), data=ce1230)

depending on whether you wanted similar wigliness (use bs = 'fs') or different wigglinesses (use by) for each estimated smooth of DateNum.

The model also needs to respect the non-negative nature of the response; you have counts and you can't have negative counts of anything. Using family = poisson or family = nb would be reasonable starting points.

$\endgroup$
11
  • 1
    $\begingroup$ You are amazing! Thank you so much for this in depth answer. I will try all of these once I get a chance to properly sit down with R. I included the plant term because someone mentioned to me that each plant in my experiment (#1-840) will likely produce flowers slightly different from each other and I needed a term in my model to account for the variation. So no, plant does not have more than one level. The column 'Plant' in my data sheet is just the label # on that plant's pot. Also the column RIL in my data is categorical - indicates if the plant is one of the several genetic lines I used. $\endgroup$
    – Abbey
    Commented Aug 2, 2018 at 14:30
  • $\begingroup$ I basically want to be able to see if the treatments differ and then how the RILs within each treatment vary in their response. I think what I want is closest to the second option you gave me, with separate smooths for each RIL / Treatment combination. Thank you for providing that code to me! That would be hectic to graph all together, so I'd like to make one more general graph (x= date, y=flower count) with a smooth for each treatment overall, and then a graph for each treatment that shows the response of the RILs within that treatment. $\endgroup$
    – Abbey
    Commented Aug 8, 2018 at 1:04
  • $\begingroup$ Even with your new code suggestion and trying family=poisson or family = nb, I am still seeing the same issue with the negative values in the response when I plot(gam). The gam also does not represent the maximum flowers produced either - its almost like the whole curve has been shifted down from where it actually should be. I am not sure how to solve this. $\endgroup$
    – Abbey
    Commented Aug 8, 2018 at 1:11
  • 1
    $\begingroup$ @Sarah plot.gam shows the smooths on the scale that they are estimated on (the log scale for poisson and nb families, by default) and most importantly the smooths are subject to a sum-to-zero constraint for identifiability reasons. This constraint centres all the smooths about 0 (to which the intercept gets added to ultimately give predictions). Hence you should see negative values here, and even negative predictions. But once you put predictions on the response scale, through the use of the inverse of the link function, there will be no negative values. $\endgroup$ Commented Aug 8, 2018 at 23:53
  • $\begingroup$ Hi again Gavin, after a long August of growth chamber experiments, I'm finally able to sit down with the gams again. I followed your advice constructing the gam models with separate smooths for each RIL and Trt combination: day1943ce.int <- transform(day1943ce, RILTrt = interaction(RIL, Treatment, drop = TRUE)) m3<-gam(Total ~ s(Day, RILTrt, k = 9, bs = "fs"), data=day1943ce.int) This gives me the plot: paste.pics/27042ec5b88ebde84417e093c22317ef (I still need to figure out predict.gam to get the data back on the response variable). $\endgroup$
    – Abbey
    Commented Sep 27, 2018 at 18:53

Your Answer

By clicking “Post Your Answer”, you agree to our terms of service and acknowledge you have read our privacy policy.

Not the answer you're looking for? Browse other questions tagged or ask your own question.