88
$\begingroup$

I have a question regarding classification in general. Let $f$ be a classifier, which outputs a set of probabilities given some data D. Normally, one would say: well, if $P(c|D) > 0.5$, we will assign a class 1, otherwise 0 (let this be a binary classification).

My question is, what if I find out, that if I classify the class as 1 also when the probabilities are larger than, for instance 0.2, and the classifier performs better. Is it legitimate to then use this new threshold when doing classification?

I would interpret the necessity for lower classification bound in the context of the data emitting a smaller signal; yet still significant for the classification problem.

I realize this is one way to do it. However, if this is not correct thinking of reducing the threshold, what would be some data transformations, which emphasize individual features in a similar manner, so that the threshold can remain at 0.5?

$\endgroup$
2
  • 14
    $\begingroup$ You already have some excellent answer, so let me just say this: your "normally" is not a normally that should be normal. I'm not sure where the "threshold at 0.5" thing became standard, and I know there is some, otherwise excellent, software that encourages the idea, but it's a very poor practice in general. $\endgroup$ Commented Nov 6, 2017 at 15:25
  • 2
    $\begingroup$ @MatthewDrury: unless, of course, the score is the well-calibrated relevant posterior probability of making no important mistake (the latter would take care of different costs of misclassification). $\endgroup$
    – cbeleites
    Commented Nov 6, 2017 at 21:43

4 Answers 4

130
$\begingroup$

Frank Harrell has written about this on his blog: Classification vs. Prediction, which I agree with wholeheartedly.

Essentially, his argument is that the statistical component of your exercise ends when you output a probability for each class of your new sample. Choosing a threshold beyond which you classify a new observation as 1 vs. 0 is not part of the statistics any more. It is part of the decision component. And here, you need the probabilistic output of your model - but also considerations like:

  • What are the consequences of deciding to treat a new observation as class 1 vs. 0? Do I then send out a cheap marketing mail to all 1s? Or do I apply an invasive cancer treatment with big side effects?
  • What are the consequences of treating a "true" 0 as 1, and vice versa? Will I tick off a customer? Subject someone to unnecessary medical treatment?
  • Are my "classes" truly discrete? Or is there actually a continuum (e.g., blood pressure), where clinical thresholds are in reality just cognitive shortcuts? If so, how far beyond a threshold is the case I'm "classifying" right now?
  • Or does a low-but-positive probability to be class 1 actually mean "get more data", "run another test"?

So, to answer your question: talk to the end consumer of your classification, and get answers to the questions above. Or explain your probabilistic output to her or him, and let her or him walk through the next steps.


Here is another way of looking at this. You ask:

what if I find out, that if I classify the class as 1 also when the probabilities are larger than, for instance 0.2, and the classifier performs better.

They key word in this question is "better". What does it mean that your classifier performs "better"? This of course depends on your evaluation metric, and depending on your metric, a "better" performing classifier may look very different. In a numerical prediction framework, I have written a short paper on this (Kolassa, 2020), but the exact same thing happens for classification.

Importantly, this is the case even if we have perfect probabilistic classifications. That is, they are calibrated: if an instance is predicted to have a probability $\hat{p}$ to belong to the target class, then that is indeed its true probability to be of that class.

As an illustration, suppose you have applied your probabilistic classifier to a new set of instances. Some of them have a high predicted probability to belong to the target class, more not. Perhaps the distribution of these predicted probabilities looks like this:
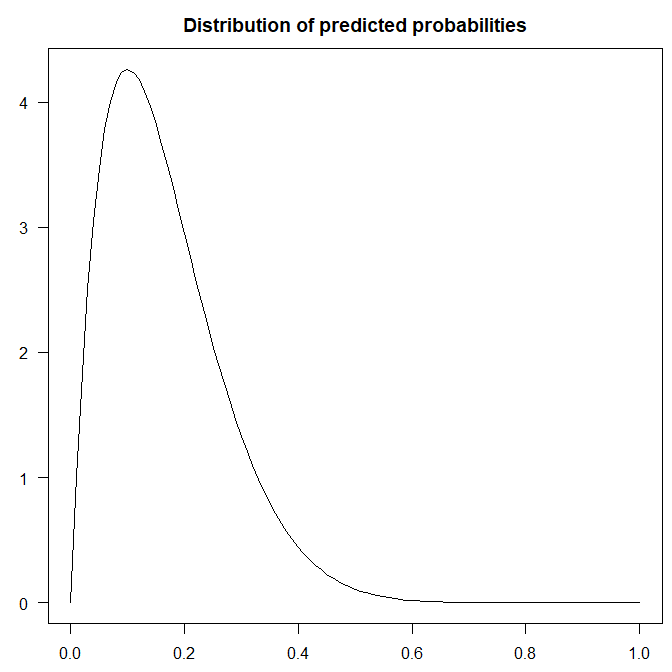
distribution

Now suppose you need to make hard 0-1 classifications. For that, you need to decide on a threshold such that you will classify each instance into the target class if its predicted probability exceeds that threshold. What is the optimal threshold to use?

Based on my paragraph above, it should not come as a surprise that this optimal threshold (where the classifier performs "best") depends on the evaluation measure. In this case, we can simulate: we draw $10^7$ samples for the predicted probability as above, then for each sample $\hat{p}$ assign it to the target class with probability $\hat{p}$, as the ground truth. In parallel, we can compare the probabilities to all possible thresholds $0\leq t\leq 1$ and evaluate common error measures for such thresholded hard classifications:
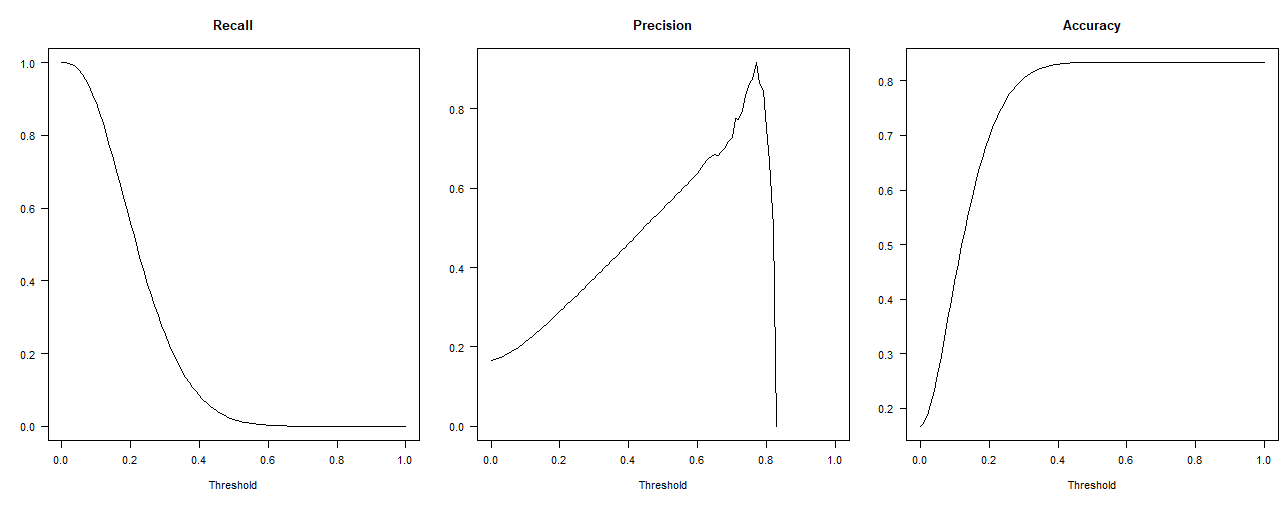
recall, precision, accuracy

These plots are unsurprising. Using a threshold of $t=0$ (assigning everything to the target class) yields a perfect recall of $1$. Precision is undefined for high thresholds where there are no instances whose predicted probabilities exceed that threshold, and it is unstable just below that high threshold, depending on whether the highest-scoring instances are in the target class or not. Finally, since we have an unbalanced dataset with more negatives than positives, assigning everything to the non-target class (i.e., using a threshold of $t=1$) maximizes accuracy.

So, these three measures elicit classifications that are probably not very useful. In practice, people often use combinations of precision and recall. One very common such combination is the F1 score, which will indeed elicit an "optimal" threshold that is not $0$ or $1$, but in between. Sounds better, right?

However, note that this again depends on the particular weight between precision and recall we want. The F1 score uses equal weighting, but it is just one member of an entire family of evaluation metrics parameterized by the relative weights of precision and recall. And, again unsurprisingly, the "optimal" threshold depends on which F$\beta$ score we use, i.e., on which weight we use, and we are back to square one: in order to find the "optimal" classifier, we need to tailor our evaluation metric to the business problem at hand.
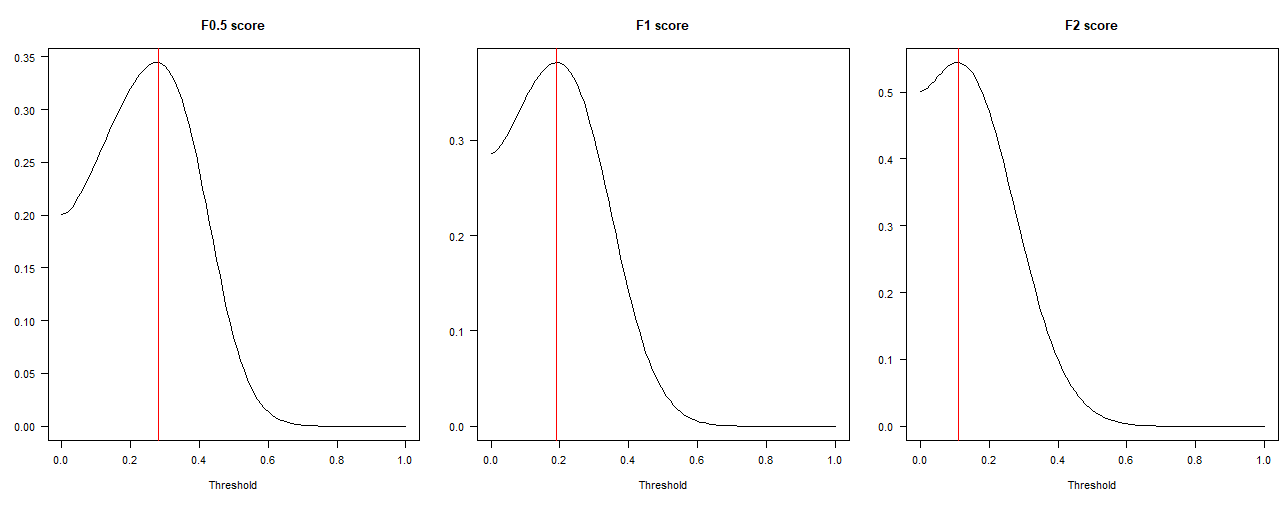
F-scores

R code:

aa <- 2
bb <- 10
n_sims <- 1e7

set.seed(1)
sim_probs <- rbeta(n_sims,aa,bb)
sim_actuals <- runif(n_sims)<sim_probs
summary(sim_probs)
summary(sim_actuals)

par(mai=c(.5,.5,.5,.1))
xx <- seq(0,1,by=.01)
plot(xx,dbeta(xx,aa,bb),type="l",xlab="",ylab="",
    las=1,main="Distribution of predicted probabilities")

thresholds <- seq(0,1,by=0.01)
recall <- sapply(thresholds,function(tt)
    sum(sim_probs>=tt & sim_actuals)/sum(sim_actuals))
precision <- sapply(thresholds,function(tt)
    sum(sim_probs>=tt & sim_actuals)/sum(sim_probs>=tt))
accuracy <- sapply(thresholds,function(tt)
    (sum(sim_probs>=tt & sim_actuals)+sum(sim_probs<tt & !sim_actuals))/n_sims)

opar <- par(mfrow=c(1,3),mai=c(.7,.5,.5,.1))
plot(thresholds,recall,type="l",xlab="Threshold",
    ylab="",las=1,main="Recall")
plot(thresholds,precision,type="l",xlab="Threshold",
    ylab="",las=1,main="Precision")
plot(thresholds,accuracy,type="l",xlab="Threshold",
    ylab="",las=1,main="Accuracy")

betas <- c(0.5,1,2)
FF <- sapply(betas,function(bb)
    sapply(thresholds,function(tt)
        (1+bb^2)*sum(sim_probs>=tt & sim_actuals)/
        ((1+bb^2)*sum(sim_probs>=tt & sim_actuals)+
        sum(sim_probs>=tt & !sim_actuals)+bb^2*sum(sim_probs<tt & sim_actuals))))

for ( ii in seq_along(betas) ) {
    plot(thresholds,FF[,ii],type="l",xlab="Threshold",
        ylab="",las=1,main=paste0("F",betas[ii]," score"))
    abline(v=thresholds[which.max(FF[,ii])],col="red")
}
$\endgroup$
7
  • 1
    $\begingroup$ Thank you very much for this insightful answer. I will further study the problem itself - I am certain I can somehow convert this property to the statistical learning part. $\endgroup$ Commented Nov 6, 2017 at 10:07
  • 11
    $\begingroup$ Very good answer: the questions are spot on! However, my profession being on the application side, whether finding a decision threshold is called statistics or not - it falls fully within my professional duties... And to me it is part of the model just like "pre-processing" is part of the model - also for the reason that all those decisions need to be covered in the validation process. $\endgroup$
    – cbeleites
    Commented Nov 6, 2017 at 21:49
  • $\begingroup$ However, I have one another question. Let's say I choose a threshold of 0.7 to classify positive and negative. Anything below 0.7 is considered as negative. But is there anyway to rank the high risk negatives from the low risk negatives? Meaning, an instance with 0.1 as probability is high risk whereas an instance with 0.69 probability is low risk (because he may share some overalps with positives). So, how do I differentiate between them? Agin, just by using this probability values? $\endgroup$
    – The Great
    Commented Feb 1, 2022 at 14:27
  • $\begingroup$ I ask this because if let's say we have a threshold of 0.9. we have an instance with a probability of 0.89 classified as negative. So, now should this be communicated as this instance has an 89% chance of being negative? Is that the right way to communicate the insight? $\endgroup$
    – The Great
    Commented Feb 1, 2022 at 14:31
  • $\begingroup$ And let's say we have an instance with 0.92 as probability. So, this is positive case. In this case, should we communicate as this instance has 92% chance of being positive? I am confused as to how to interpret this? can help me with the interpretation part? $\endgroup$
    – The Great
    Commented Feb 1, 2022 at 14:34
18
$\begingroup$

Stephan's answer is great. It fundamentally depends on what you want to do with the classifier.

Just adding a few examples.

A way to find the best threshold is to define an objective function. For binary classification, this can be accuracy or F1-score for example. Depending on which you choose, the best threshold will be different. For F1-score, there is an interesting answer here: What is F1 Optimal Threshold? How to calculate it? . But saying "I want to use F1-score" is where you actually make the choice. Whether this choice is good or not depends on the final purpose.

Another way to see it is facing the trade-off between exploration and exploitation (Stephan's last point): The multi-armed bandit is an example of such a problem: you have to deal with two conflicting objectives of acquiring information and choosing the best bandit. One Bayesian strategy is to choose each bandit randomly with the probability it is the best. It's not exactly classification but dealing with output probabilities in a similar way.

If the classifier is just one brick in decision making algorithm, then the best threshold will depend on the final purpose of the algorithm. It should be evaluated and tuned in regard to the objective function of the whole process.

$\endgroup$
2
  • $\begingroup$ Thank you for another great answer. If I understand correctly, if I am dealing with the final step in the pipeline, it is completely legitimate to directly optimize the threshold. $\endgroup$ Commented Nov 6, 2017 at 16:11
  • 1
    $\begingroup$ @sdgawerzswer: yes. And a) make sure you optimize the answer to the right question and b) make sure you validate that decision (and threshold finding) together with the rest of the model. $\endgroup$
    – cbeleites
    Commented Nov 6, 2017 at 21:51
4
$\begingroup$

There is possibly some value in considering how the probability is calculated. These days, Classifiers use a bias vector, which is multiplied by a matrix (linear algebra). As long as there are any non-zero values in the vector, the probability (the product of the vector and the matrix) will never be 0.

This causes confusion in the real world of people who didn't take linear algebra, I guess. They are bothered by the fact that there are probability scores for items that they think should have 0. In other words, they are confusing the statistical input, from the decision based on that input. As humans, we could say that something with a probability of 0.0002234 is the same as 0, in most "practical" use cases. In higher cognitive science discussions, maybe, there is an interesting discussion about why the bias vector does this, or rather, is this valid for cognitive applications.

$\endgroup$
3
$\begingroup$

There is no wrong threshold. The threshold you choose depends of your objective in your prediction, or rather what you want to favor, for example precision versus recall (try to graph it and measure its associated AUC to compare different classification models of your choosing).

I am giving you this example of precision vs recall, because my own problem case i am working on right now, i choose my threshold depending of the minimal precision (or PPV Positive Predictive Value) i want my model to have when predicting, but i do not care much about negatives. As such i take the threshold that corresponds to the wanted precision once i have trained my model. Precision is my constraint and Recall is the performance of my model, when i compare to other classification models.

$\endgroup$

Your Answer

By clicking “Post Your Answer”, you agree to our terms of service and acknowledge you have read our privacy policy.

Not the answer you're looking for? Browse other questions tagged or ask your own question.