Frank Harrell has written about this on his blog: Classification vs. Prediction, which I agree with wholeheartedly.
Essentially, his argument is that the statistical component of your exercise ends when you output a probability for each class of your new sample. Choosing a threshold beyond which you classify a new observation as 1 vs. 0 is not part of the statistics any more. It is part of the decision component. And here, you need the probabilistic output of your model - but also considerations like:
- What are the consequences of deciding to treat a new observation as class 1 vs. 0? Do I then send out a cheap marketing mail to all 1s? Or do I apply an invasive cancer treatment with big side effects?
- What are the consequences of treating a "true" 0 as 1, and vice versa? Will I tick off a customer? Subject someone to unnecessary medical treatment?
- Are my "classes" truly discrete? Or is there actually a continuum (e.g., blood pressure), where clinical thresholds are in reality just cognitive shortcuts? If so, how far beyond a threshold is the case I'm "classifying" right now?
- Or does a low-but-positive probability to be class 1 actually mean "get more data", "run another test"?
So, to answer your question: talk to the end consumer of your classification, and get answers to the questions above. Or explain your probabilistic output to her or him, and let her or him walk through the next steps.
Here is another way of looking at this. You ask:
what if I find out, that if I classify the class as 1 also when the probabilities are larger than, for instance 0.2, and the classifier performs better.
They key word in this question is "better". What does it mean that your classifier performs "better"? This of course depends on your evaluation metric, and depending on your metric, a "better" performing classifier may look very different. In a numerical prediction framework, I have written a short paper on this (Kolassa, 2020), but the exact same thing happens for classification.
Importantly, this is the case even if we have perfect probabilistic classifications. That is, they are calibrated: if an instance is predicted to have a probability $\hat{p}$ to belong to the target class, then that is indeed its true probability to be of that class.
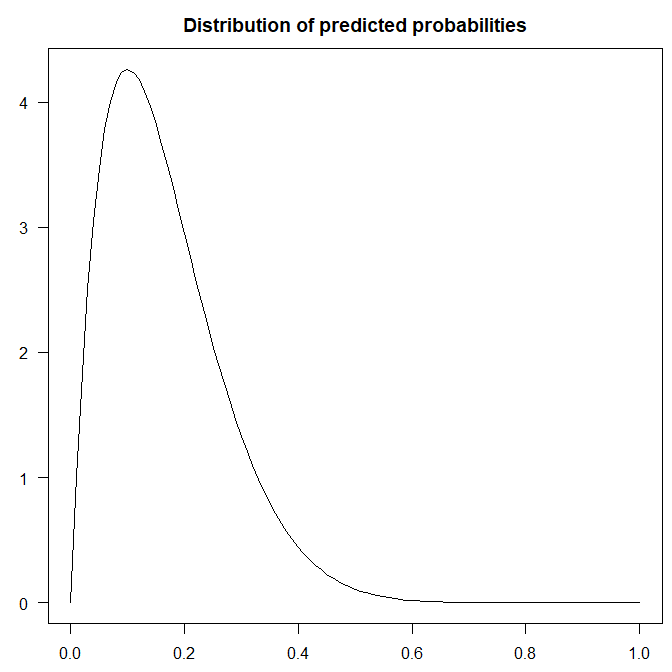
As an illustration, suppose you have applied your probabilistic classifier to a new set of instances. Some of them have a high predicted probability to belong to the target class, more not. Perhaps the distribution of these predicted probabilities looks like this:

Now suppose you need to make hard 0-1 classifications. For that, you need to decide on a threshold such that you will classify each instance into the target class if its predicted probability exceeds that threshold. What is the optimal threshold to use?
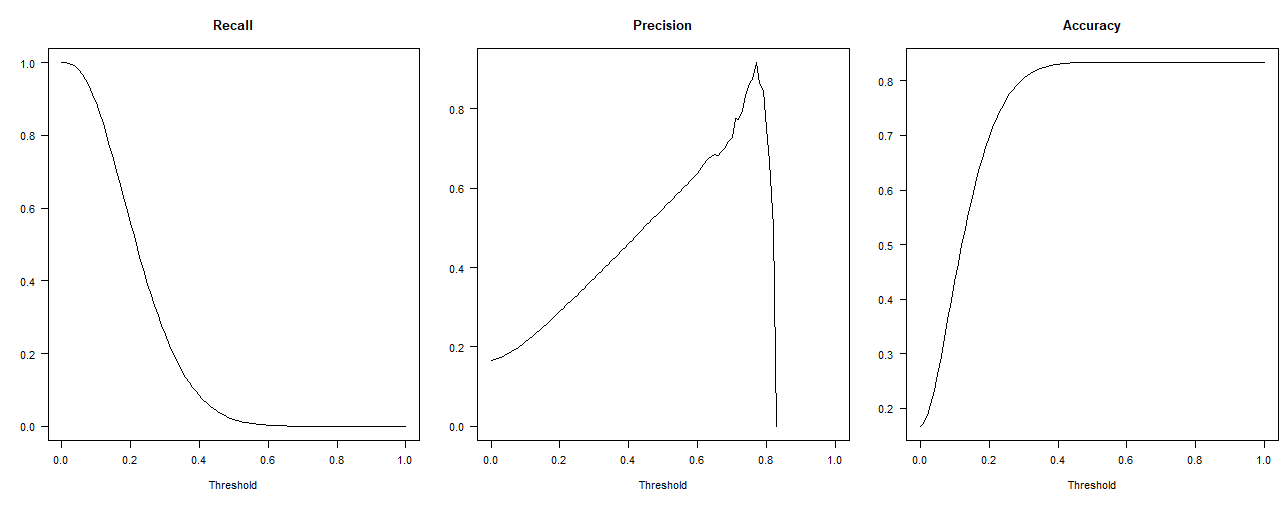
Based on my paragraph above, it should not come as a surprise that this optimal threshold (where the classifier performs "best") depends on the evaluation measure. In this case, we can simulate: we draw $10^7$ samples for the predicted probability as above, then for each sample $\hat{p}$ assign it to the target class with probability $\hat{p}$, as the ground truth. In parallel, we can compare the probabilities to all possible thresholds $0\leq t\leq 1$ and evaluate common error measures for such thresholded hard classifications:

These plots are unsurprising. Using a threshold of $t=0$ (assigning everything to the target class) yields a perfect recall of $1$. Precision is undefined for high thresholds where there are no instances whose predicted probabilities exceed that threshold, and it is unstable just below that high threshold, depending on whether the highest-scoring instances are in the target class or not. Finally, since we have an unbalanced dataset with more negatives than positives, assigning everything to the non-target class (i.e., using a threshold of $t=1$) maximizes accuracy.
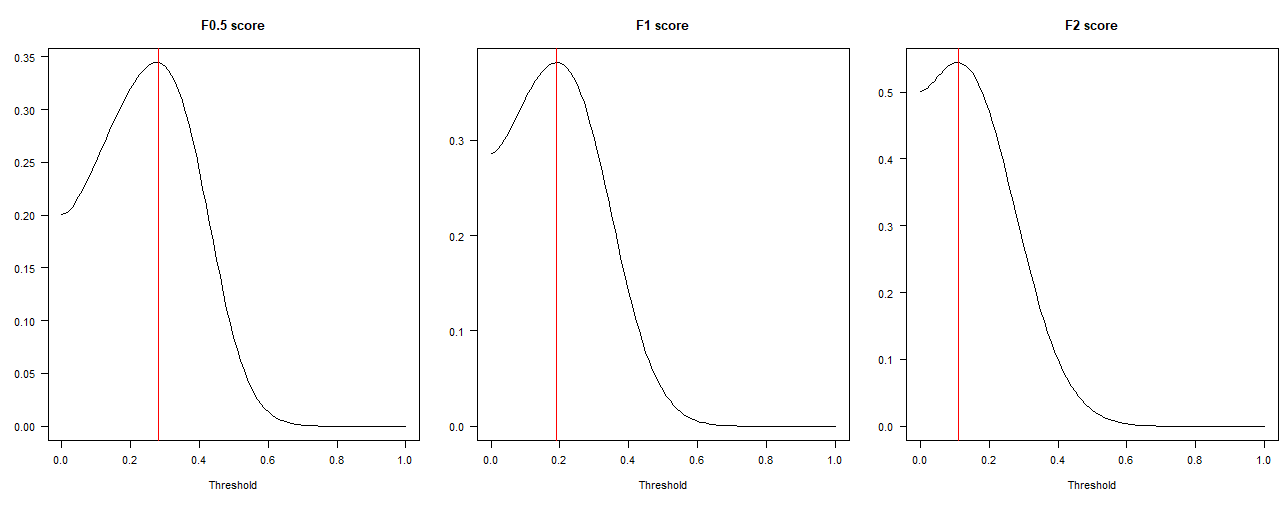
So, these three measures elicit classifications that are probably not very useful. In practice, people often use combinations of precision and recall. One very common such combination is the F1 score, which will indeed elicit an "optimal" threshold that is not $0$ or $1$, but in between. Sounds better, right?
However, note that this again depends on the particular weight between precision and recall we want. The F1 score uses equal weighting, but it is just one member of an entire family of evaluation metrics parameterized by the relative weights of precision and recall. And, again unsurprisingly, the "optimal" threshold depends on which F$\beta$ score we use, i.e., on which weight we use, and we are back to square one: in order to find the "optimal" classifier, we need to tailor our evaluation metric to the business problem at hand.

R code:
aa <- 2
bb <- 10
n_sims <- 1e7

set.seed(1)
sim_probs <- rbeta(n_sims,aa,bb)
sim_actuals <- runif(n_sims)<sim_probs
summary(sim_probs)
summary(sim_actuals)

par(mai=c(.5,.5,.5,.1))
xx <- seq(0,1,by=.01)
plot(xx,dbeta(xx,aa,bb),type="l",xlab="",ylab="",
    las=1,main="Distribution of predicted probabilities")

thresholds <- seq(0,1,by=0.01)
recall <- sapply(thresholds,function(tt)
    sum(sim_probs>=tt & sim_actuals)/sum(sim_actuals))
precision <- sapply(thresholds,function(tt)
    sum(sim_probs>=tt & sim_actuals)/sum(sim_probs>=tt))
accuracy <- sapply(thresholds,function(tt)
    (sum(sim_probs>=tt & sim_actuals)+sum(sim_probs<tt & !sim_actuals))/n_sims)

opar <- par(mfrow=c(1,3),mai=c(.7,.5,.5,.1))
plot(thresholds,recall,type="l",xlab="Threshold",
    ylab="",las=1,main="Recall")
plot(thresholds,precision,type="l",xlab="Threshold",
    ylab="",las=1,main="Precision")
plot(thresholds,accuracy,type="l",xlab="Threshold",
    ylab="",las=1,main="Accuracy")

betas <- c(0.5,1,2)
FF <- sapply(betas,function(bb)
    sapply(thresholds,function(tt)
        (1+bb^2)*sum(sim_probs>=tt & sim_actuals)/
        ((1+bb^2)*sum(sim_probs>=tt & sim_actuals)+
        sum(sim_probs>=tt & !sim_actuals)+bb^2*sum(sim_probs<tt & sim_actuals))))

for ( ii in seq_along(betas) ) {
    plot(thresholds,FF[,ii],type="l",xlab="Threshold",
        ylab="",las=1,main=paste0("F",betas[ii]," score"))
    abline(v=thresholds[which.max(FF[,ii])],col="red")
}


