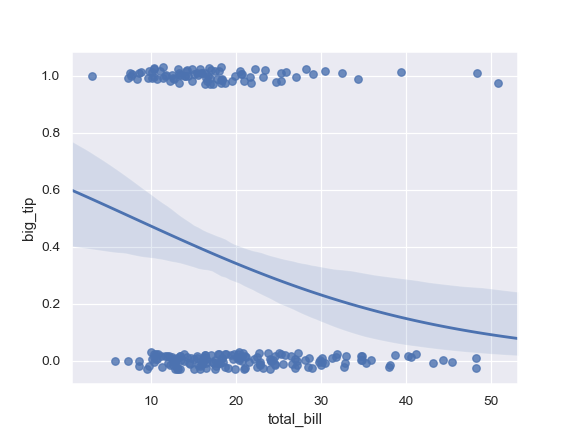
I have been using a regplot tool from the seaborn recently, and I really liked its plots where it shows both the regression line, and the confidence levels around it for different input values, like on the plot below. How would one compute the width of that interval based on the input? I would expect that the more training data was distributed around the current input, the lower is the narrower is the interval (higher the confidence). Are there also similar method to do such estimations for non-linear models, such as NNs?
1 Answer
The CI band is constructed by bootstrapping - repeatedly resampling the target variable for each level of the (binned) input, computing the mean of each resample, and computing the CI of the resulting array of means. (The original means are used for the main trend, which is why the band is not necessarily symmetrical). Source.
The width of the CI depends not just on the amount of data, but the variance/presence of outliers. If you had data that was [0, 0, 0, 5, 0], the band would be wider than if the data were [.2, .2, .2, .2, .2]:
np.random.seed(123)
a = np.array([0, 0, 0, 0, 5])
b = np.array([.2, .2, .2, .2, .2])

a_resample = np.random.choice(a, size=[100, 5], replace=True)
b_resample = np.random.choice(b, size=[100, 5], replace=True)

print(np.mean(a_resample, axis=1).std())
# >> 0.859 (YMMV)

print(np.mean(b_resample, axis=1).std())
# >> 5.55e-17 (ie, 0)
Doing this for a neural network would not be very natural IMO - how do you bin typical NN inputs like images or text? How do you extend this visualization to the multi-class case?
The most useful case I could imagine off the cuff would be using for training/validation curves, eg by resampling error estimates inside each validation batch/epoch. Not sure how easy it would be to use seaborn for this, but wouldn't be too hard to write yourself.
-
$\begingroup$ Thanks, that's clear. Regarding NNs: even if the raw data is non-numeric, still the features usually are, and overall I just meant using a simple feed-forward NN as a more general model than the LR. From your answer is seems that the CI estimates used in
seabornare model-independent, though. $\endgroup$– SBFCommented Jul 26, 2018 at 6:20 -
$\begingroup$ It's not the data's origin; it's the dimensionality of its representation. An image or a text corpus typically uses thousands to hundreds of thousands of input dimensions. For this technique, continuous inputs must be binned. As the number of input dimensions increases, you need more bins to span your input space, and you then need exponentially more data to keep all those bins populated enough to reliably resample. $\endgroup$– GianniCommented Jul 26, 2018 at 16:10

