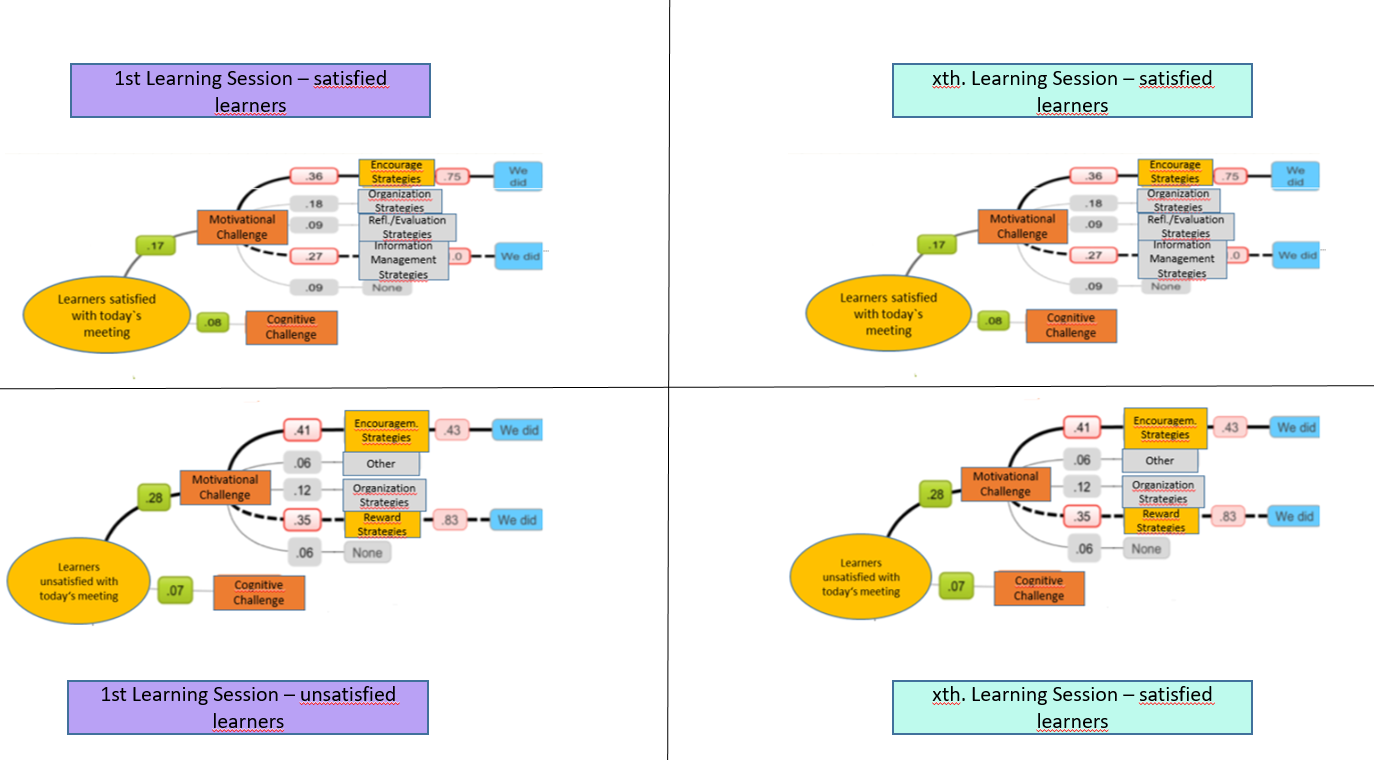
I have time series data: students that learned in groups for minimum 3 times and maximum 10 times and for each learning group session had to state if they faced a motivational OR a cognitive problem, what strategies they used to regulate their problem, and how satisfied they were overall with their learning.
First, I want to split my sample into four different subgroups:
- a first group includes only data from the 1st measurement and here only people that were rather satisfied with their 1st learning process
- another subgroup only including data from the 1st measurement and here only learners that are rather not satisfied with their 1st learning process
- a third subgroup only including data from the last measurement and here only people that are rather satisfied with their last learning process
- a last subgroup with data only from the last measurement and here only people that are rather not satisfied with their last learning process
Then, I want to plot a decision tree showing the probability with which SATISFIED learners faced a motivational vs. a cognitive challenge during their first learning process, and the strategies they activated here. As well, I want to plot the same decision tree for UNSATISFIED learners for their first learning process.
Further, I would like to draw both trees for the 10th learning session. My plan is it to predict what strategies all learners will use in their 10th learning process (as I said, I have only for like 20% of the participants the data for the 10th learning process). How can I proceed to make such a prediction?
a) Do I need a classification or a regression tree? (each learner could mention more strategies, and could mention also more strategies of a same type)
b) And is it possible to predict what strategies all students would face in their 10th learning process only based on the data for the 1st learning process? Or should I then also include data from all available data points? However, I cannot imagine how to do that.

