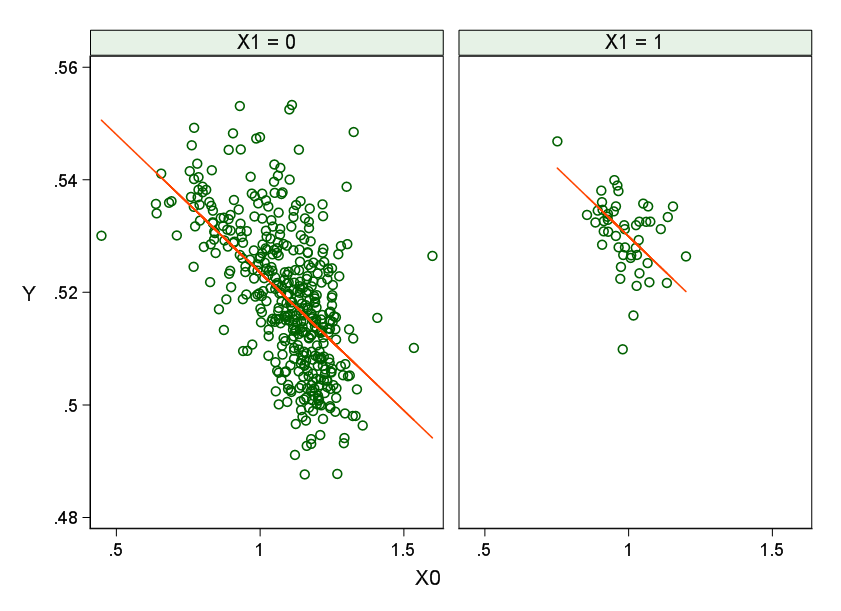
I checked for related questions before posting this. I found some similar questions (like this), but I couldn't find any question that answers mine.
I have two independent variables, one continuous and one categorical (1 or 0). My dependent variable is continuous in [0,1].
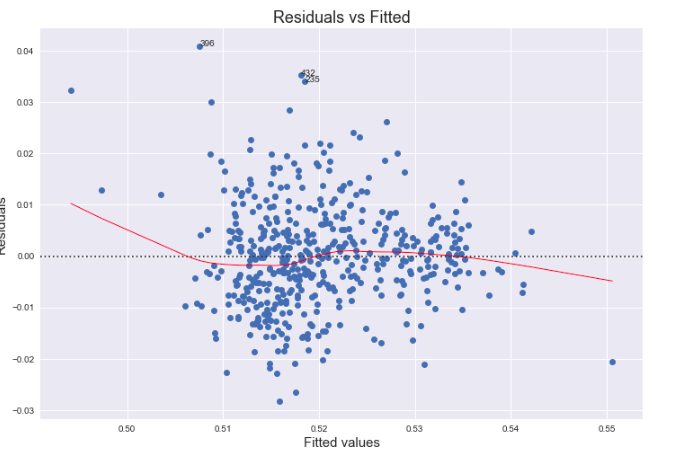
I want to analyze the effect of each independent variable. I understood I should apply regression analysis. However, according to resources I read like here and here, there is more than one way to do that. I tried to do Linear Regression (Ordinary Least Squares). The $R^2$ I obtained is 0.509. Here is the residual plot I obtained:
I think that $R^2$ is not good enough. So, I want to improve my model. I tried to analyze the residual plot by using information from here. Unfortunately, I think my plot doesn't look like any other plot provided on the last link I shared. It is said that there shouldn't be any pattern in the residual plot but I cannot decide whether my plot contains some kind of pattern.
To sum up, I don't know what should I do to improve my model: Should I try to use a non-linear model? Should I transform my data points ?
EDIT
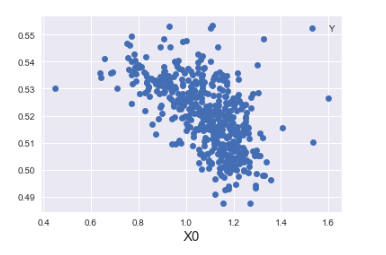
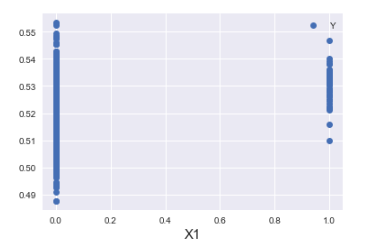
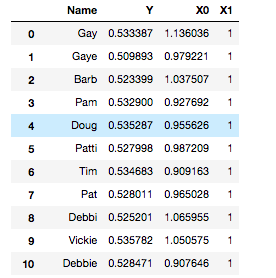
As requested in the comments I put some other figures:
1) X0 - Y chart
2) X1 - Y chart
3) Some of the data points I have

