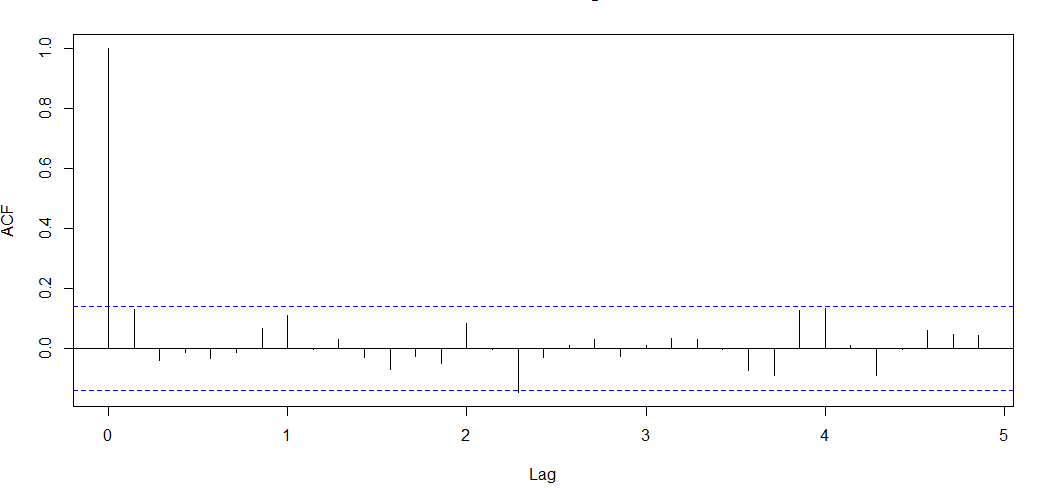
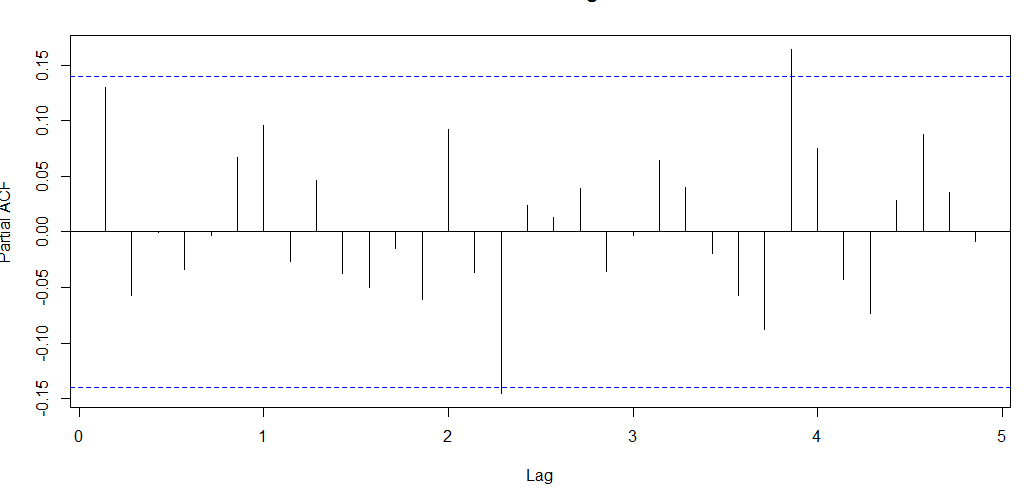
 I am running a TS model & below are my ACF & PACF plots... In theory if the ACF plot is significant after Pth lag & PACF shows some geometric decay we can infer it is a MA series but my output is a little confusing where it doesnt follow any geometric decay for the PACF plot & also ACF is significant after 0th lag..How can I infer the model parameters/orders from this plot. Please advise.ACF Plot

1 Answer
Your acf and pacf plot is ambiguous. The paradigm you are trying to follow to identify the SARIMA model sometimes works when 1) there are no one-time pulses in the data 2) there are no seasonal pulses in the data 3) there are no level/step shifts in the data 4) there are no local trends in the data 5) the underlying (waiting to be discovered ) model generates errors that has constant variance 6) the underlying model has constant parameters over time.
A more robust paradigm/procedure to follow is suggested here
https://autobox.com/pdfs/ARIMA%20FLOW%20CHART.pdf
If you post your data , I will try and help further.
-
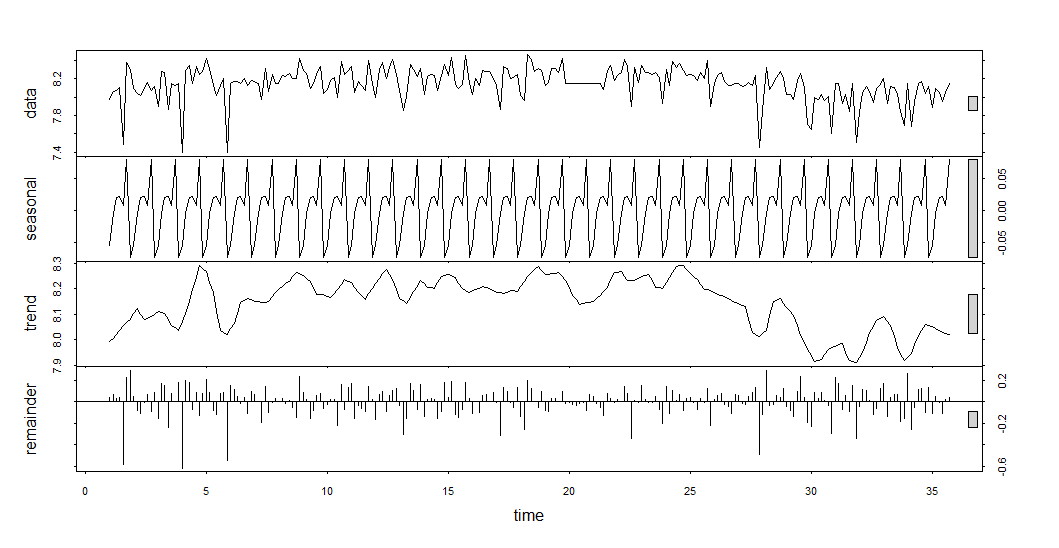
$\begingroup$ Thank you. Added decomp plot for more insights about series..hope this will help you comprehending the series.. $\endgroup$– CoolsunCommented Dec 18, 2018 at 13:35
-
$\begingroup$ add your data ... that will help the comprehension ... graphs and stuff are merely suggestive . $\endgroup$ Commented Dec 18, 2018 at 14:03

