1
$\begingroup$

I am testing the co-movement between 2 exchanges by using the dynamic conditional correlation (DCC) developed by Robert Engle (2002). I want to apply this method in stata 12 and used this command:

Mgarch DCC (var1 var2=), arch(1) garch(1) distribution(t)

I read that it should give me a column with correlations per time unit. But i am not getting this colums. Does someone have any idea how to apply the DCC in Stata 12?

$\endgroup$
1
  • $\begingroup$ If your only interest here is how to get Stata to do this, this question is off-topic for CV (it may be on-topic for Stack Overflow, I'm not sure). You may want to read our FAQ. Are you wondering / do you have a question about garch more generally? $\endgroup$ Commented Oct 27, 2012 at 3:00

1 Answer 1

3
$\begingroup$

You need to read the help file for -mgarch dcc postestimation-. You will find the following example of computing the dynamic correlations and their forecasts.

webuse stocks
mgarch dcc (toyota nissan = , noconstant) (honda = , noconstant), ///
    arch(1) garch(1)
tsappend, add(50)
predict H*, variance dynamic(2016)
tsline H_nissan_toyota H_honda_toyota H_honda_nissan if t>1600, ///
    legend(rows(3)) xline(2015)

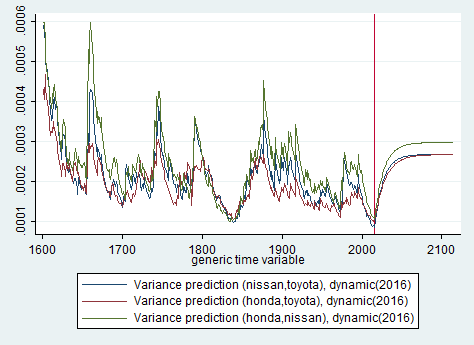
which produces the graph of the dynamic correlations between the three individual stocks.
enter image description here


Update 1

If you are only interested in the in-sample fits of the conditional correlations, then it becomes really simple, and you can drop the tsappend command:

webuse stocks
mgarch dcc (toyota nissan = , noconstant) (honda = , noconstant), ///
    arch(1) garch(1)
predict H*, variance
tsline H_nissan_toyota H_honda_toyota H_honda_nissan if t>1600, ///
    legend(rows(3)) 

The option t>1600 asks that the in-sample predictions be plotted starting at "time period" 1600 (this dataset has a time index that runs from 1 to 2015). The xline option asks for a vertical line at t=2015 (in the previous example, this was to indicate that at t=2015, forecasts were out-of-sample), and the legend(row(3)) specifies that you want the graph legend to placed in three separate rows -- this is just graph formatting.


Update 2

The OP has asked about adding explanatory variables in the equations for the conditional mean and the conditional variance. This is explained in the help file for mgarch dcc. The syntax is

        mgarch dcc eq [eq ... eq] [if] [in] [, options]
    where each eq has the form
        (depvarlist = [indepvars] [, eqoptions])
  • The optional argument [indepvars] allows you to add explanatory variables to the conditional mean to any one, to sets of, or to all the dependent variables at the same time.

  • The optional equation options, eqoptions, has the following optional component

      het(varlist)             include varlist in the specification of the conditional variance
    

which allows you to add explanatory variables to the conditional variance equation of any one, to sets of, or to all the dependent variables at the same time.

Example

So, for example, if you had three series return1, return2 and return3, and three independent variables x1, x2 and x3, then the command

mgarch dcc (return1 return2 = x1 x2, het(x1 x2 x3)) (return3 = x3, het(x1 x2 x3)) 

implies that the variables x1 and x2 enter the conditional mean of return1 and return2, x3 enters the conditional mean of return3. Similarly, x1, x2 and x3 enter the conditional variance of return1, return2 and return3.

$\endgroup$
15
  • $\begingroup$ Thank you for the answer, it helps me a lot. I had some other questions because i dont know how to interpret the results. The example is about forecasting the correlations, but I dont want to do that. I only want to test the correlation in the past. So i suggest that i dont need the "tsappend, add(50)" command. The only thing that i want to do is to calculate the dynamic correlation for every time unit. Is the predict command still the correct command to do this? and what do i have to use for my dataset for this command: t>1600, /// legend(rows(3)) xline(2015). What do the numbers say? $\endgroup$
    – M.Assad
    Commented Oct 28, 2012 at 19:04
  • $\begingroup$ I have updated the answer to address your follow-up questions. $\endgroup$ Commented Oct 29, 2012 at 2:16
  • $\begingroup$ It works, thank you! I also read that it is possible to add explanatory variables in the DCC. Is it also possible to add Control variables to my model and do you know how to do that? $\endgroup$
    – M.Assad
    Commented Oct 30, 2012 at 12:36
  • $\begingroup$ I have updated my answer. I think you should read the pdf help manual carefully for very good examples of the use of all the features of mgarch. $\endgroup$ Commented Oct 30, 2012 at 13:17
  • $\begingroup$ @M.Assad you should consider accepting the answer as correct if you have no further queries. $\endgroup$ Commented Nov 1, 2012 at 4:55

Your Answer

By clicking “Post Your Answer”, you agree to our terms of service and acknowledge you have read our privacy policy.

Not the answer you're looking for? Browse other questions tagged or ask your own question.