3
$\begingroup$

I have used a DCC Garch model to estimate the co-movement between 2 indices using the following command in Stata:

mgarch dcc (X Y = , noconstant), arch(1) garch(1) constraints(1 2)
predict H*, variance

After the variance prediction I get a column with the variances per time unit. My question is how to transform the variances to the correlations per time unit?

$\endgroup$
1
  • $\begingroup$ Could this be helpful for you? $\endgroup$ Commented Jul 15, 2013 at 13:00

5 Answers 5

3
$\begingroup$

You can just use the fact that the correlation at any time $t$ of two series in the DCC GARCH model, $Y_{1t}, Y_{2t}$ is just $\tfrac{\mathbb{C}(Y_{1t}, Y_{2t})}{\sqrt{\mathbb{V}(Y_{1t})\mathbb{V}(Y_{1t})}}$.

You can compute this manually as in the following example

webuse stocks, clear

// fit the DCC GARCH model
mgarch dcc (toyota nissan = , noconstant) (honda = , noconstant), ///
    arch(1) garch(1)

// predict the conditional covariances
predict condvar*, variance 

// generate the correlations
g condcorr_nissan_toyota = condvar_nissan_toyota/ ///
    (sqrt(condvar_nissan_nissan)*sqrt(condvar_toyota_toyota))
g condcorr_honda_toyota = condvar_honda_toyota/ ///
    (sqrt(condvar_honda_honda)*sqrt(condvar_toyota_toyota))
g condcorr_honda_nissan = condvar_honda_nissan/ ///
    (sqrt(condvar_nissan_nissan)*sqrt(condvar_honda_honda))

// plot the conditional correlations
tsline condcorr_nissan_toyota condcorr_honda_toyota condcorr_honda_nissan, ///
    legend(rows(3)) 
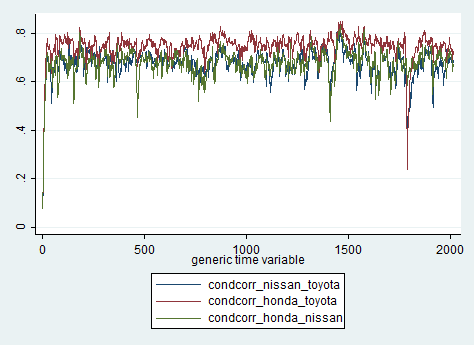
enter image description here

$\endgroup$
0
$\begingroup$

This is my do file for command to study the dcc between stock return of one country Chile and U.S with t-distribution. I hope it is helpful.

gen t=_n
tsset t, daily
mgarch dcc (reche=L.reche L.reus) (reus=L.reus), arch (1) garch(1) distribution(t)
predict H*, variance
gen corr_che_us= H_reus_reche/(sqrt( H_reche_reche)*sqrt( H_reus_reus))
tsline corr_che_us
$\endgroup$
0
$\begingroup$

There are some very important steps to be taken before defining your time series.

You can generate time variable first:

//generate time variable t
gen t=_n
//time series set
tsset t

Then start the above steps.

After all the analysis is done, you can copy paste the real date to the value. Then it will give you a good graph. Otherwise, especially for 5-day per week data, it may create problems.

$\endgroup$
1
  • $\begingroup$ Does that generate the correlations the OP asked for? $\endgroup$
    – mdewey
    Commented Oct 1, 2016 at 8:59
0
$\begingroup$

Hi Can you help me to identify the mistake.I am trying to generate conditional variance plots.These are my commands: mgarch dcc ( zar euro), arch(1) garch(2) predict H*, variance gen corr zar euro= H_euro_zar/(sqrt( H_zar_zar)*sqrt( H_euro_euro)) and I am getting this answer:

variable zar already defined

$\endgroup$
-1
$\begingroup$

The predict command should generate variances and covariances? In which case just generate the correlations manually via the correlation formula.

$\endgroup$
1
  • $\begingroup$ Should you clarify you answer and provide some details. $\endgroup$ Commented Feb 19, 2013 at 12:07

Your Answer

By clicking “Post Your Answer”, you agree to our terms of service and acknowledge you have read our privacy policy.

Not the answer you're looking for? Browse other questions tagged or ask your own question.