First of all $f(x)$ needs to be a density, so $\sin(x)$ doesn't do the job. Let's sample from standard normal distribution, i.e. $$f(x)=\frac{1}{\sqrt{2\pi}}e^{-x^2/2}$$ in the range $[-3,3]$, where most of the samples reside.
A note for your C code: You shouldn't return the number from main function. Either write to a file or print out for plotting (or directly plot if you have suitable libraries). Most random samplers give you uniform RVs in $[0,1]$, so let's assume we have such $X,Y$. You can achieve that in C by dividing the generated number with INT_MAX macro.
First we scale $X$ to our new range, i.e. $X\leftarrow6X-3$. Now, our $X$ is uniform in the range $[-3,3]$. Also, $\max f(x)=1/\sqrt{2\pi}$, and therefore let $Y\leftarrow \sqrt{2\pi}Y$. Then, we compare $Y$ and $f(X)$ and accept the scaled $X$ if $Y$ is smaller. Here is an example C code:
#include <stdio.h>
#include <math.h>
#include <stdlib.h>
#include <time.h>
#include <limits.h>

int main()
{
    srand(time(NULL));

    int N = 100000;
    for(int i = 0; i < N; i++){
        double x = ((double) rand()) / INT_MAX;
        double y = ((double) rand()) / INT_MAX;

        x = 6 * x - 3;
        y = y / sqrt(2*M_PI);

        if( y < 1/sqrt(2*M_PI) * exp(-x*x/2) )
            printf("%f\n", x);
    }

    return 0;
}
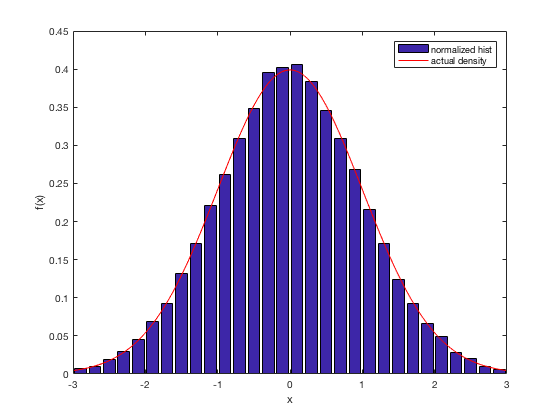
If you redirect the standard output to a file, via > opearator while running, you'll see a histogram as follows:

Now, why does it work?
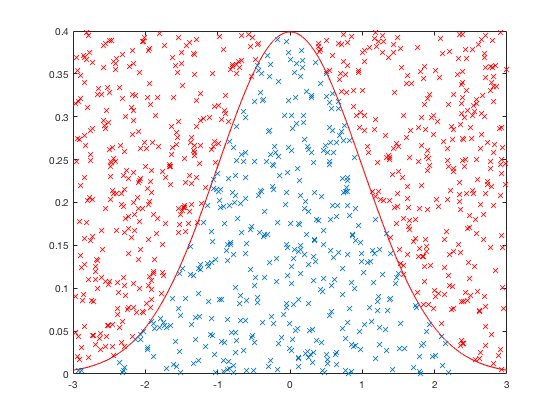
By sampling $X$ within $[a,b]$ (i.e. the interested range) and $Y$ within $[0,f_{max}]$, you create a box in the x-y plane, and sample random points on it as follows, just like you're throwing darts to a rectangular window:

Then, you accept the points which are under the curve, i.e. $y<f(x)$, which actually makes up the histogram for you, i.e. the higher $f(x)$ in the region, the higher the probability of acceptance.


