0
$\begingroup$

I have a series of 100 points

My dataset can be found here . Each row is a data series. The plot for 90th row is
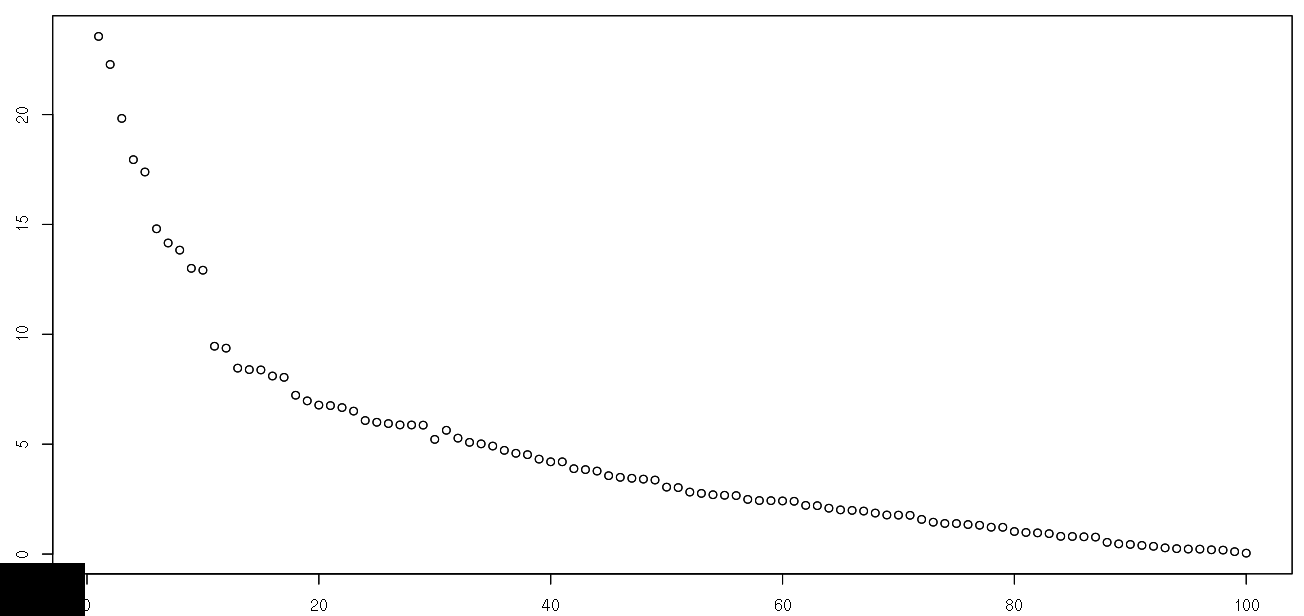
enter image description here

It's easy to detect outliers visually by plotting example. I tried using hampel to find outliers assuming it as time series.

x <- read.table("anomaly_s57.dat")
data <- as.matrix(x)

plot_hampel = function(row, k = 2, t = 3) {

    plot.ts(data[row,])
    hp <- hampel(data[row,], k , t)
    y <- data[row,hp$ind]
    x <- hp$ind
    points(x,y,col="red")

} 

But it is not good enough. It misses some small peaks. Is the time series assumption not correct? Any statistical fitting is possible? How to detect outliers in this data series considering each row of the data set as independent data series? It is known that total number of outliers is around 500.

$\endgroup$
6
  • $\begingroup$ I searched for "hampel" in R and found one defunct statistic and one from the rlm (robust linear model) function in the MASS library. Can you say what you sere using? $\endgroup$
    – Peter Flom
    Commented Nov 24, 2012 at 13:56
  • $\begingroup$ I don't get this. Every column is an observation? $\endgroup$
    – user603
    Commented Nov 24, 2012 at 14:34
  • $\begingroup$ @PeterFlom I was using hampel from MASS $\endgroup$ Commented Nov 24, 2012 at 15:16
  • $\begingroup$ @user603 Each row is an independent dataset $\endgroup$ Commented Nov 24, 2012 at 15:17
  • $\begingroup$ @Pankaj More: ok but they all have 100 columns. Are these columns related? Can we think of each row as an observation and each column as variables/measurments? $\endgroup$
    – user603
    Commented Nov 24, 2012 at 18:52

1 Answer 1

1
$\begingroup$

How are you defining "outlier"? Looking at the example plot, I don't see any real outliers. There's just some noise in the data.

However, if you wanted to identify the points that were farthest from the fitted line, that would be fairly straightforward using the predict or residuals functions in the appropriate model. E.g.

x <- 1:100
y <- 3*x + rnorm(100)
m1 <- lm(y~x)
residm1 <- m1$residuals
ranks <- rank(residm1)

You could then select the largest n values for inspection or choose a minimum residual that would qualify as an "outlier".

$\endgroup$
2
  • $\begingroup$ It doesnt look like it will fit in a polynomial model? Or will it? How to find the best non-linear model which will fit here? $\endgroup$ Commented Nov 24, 2012 at 15:52
  • $\begingroup$ Search "curve fitting" for some ideas. $\endgroup$
    – Peter Flom
    Commented Nov 24, 2012 at 16:29

Your Answer

By clicking “Post Your Answer”, you agree to our terms of service and acknowledge you have read our privacy policy.

Not the answer you're looking for? Browse other questions tagged or ask your own question.