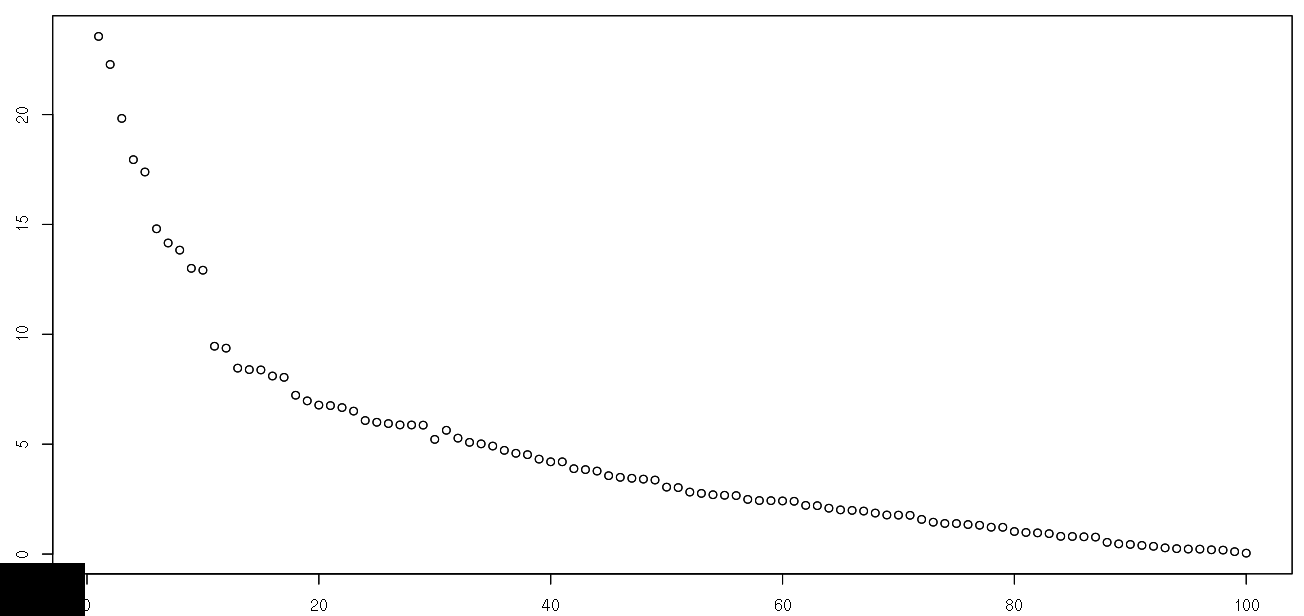
I have a series of 100 points
My dataset can be found here . Each row is a data series. The plot for 90th row is

It's easy to detect outliers visually by plotting example. I tried using hampel to find outliers assuming it as time series.
x <- read.table("anomaly_s57.dat")
data <- as.matrix(x)

plot_hampel = function(row, k = 2, t = 3) {

    plot.ts(data[row,])
    hp <- hampel(data[row,], k , t)
    y <- data[row,hp$ind]
    x <- hp$ind
    points(x,y,col="red")

}
But it is not good enough. It misses some small peaks. Is the time series assumption not correct? Any statistical fitting is possible? How to detect outliers in this data series considering each row of the data set as independent data series? It is known that total number of outliers is around 500.

Rand found one defunct statistic and one from therlm(robust linear model) function in theMASSlibrary. Can you say what you sere using? $\endgroup$