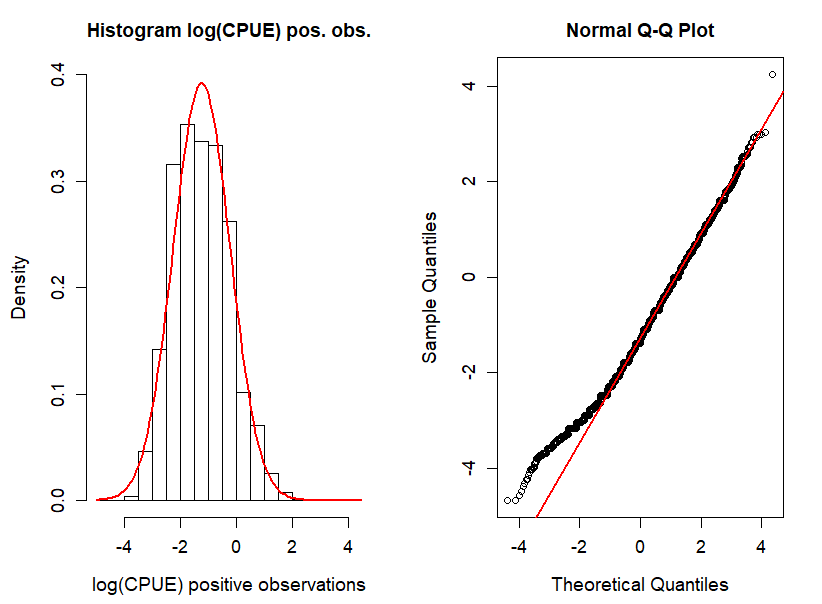
I cannot speak to how heavy a tail is too heavy but I can recommend some readings and other distributions. I highly recommend first reading Maunder and Punt (2004) on approaches for standardizing fisheries CPUE data. In addition to the lognormal, I would consider a Poisson or negative binomial using your effort as an offset in the model as these models are based on counts. You can also consider the gamma or Tweedie distributions. See Shono (2008) for an example application of the Tweedie distribution for CPUE standardization. If you have a lot of zeros, you may want to consider zero-inflated or hurdle models. As determining the most appropriate model, you want to look at plots of residuals and predictions of observed data. I often calculate the model dispersion as an initial indication of model fit. Refer to Zuur et al. (2009) for excellent guidance on model selection. Hinton and Maunder (2003) also provide guidance on model tests and comparisons.
Hinton, M.G., and M.N. Maunder. 2003. Methods for standardizing CPUE and how to select among them. ICCAT Collective Volume of Scientific Papers 56:169-177.
Maunder, M.N., and A.E. Punt. 2004. Standardizing catch and effort data: a review of recent approaches. Fisheries Research 70(2-3):141-159.
Shono, H. 2008. Application of the Tweedie distribution to zero-catch data in CPUE analysis. Fisheries Research 93(1-2):154-162.
Zuur, A.F., E.N. Ieno, N.J. Walker, A.A. Saveliev, and G.M. Smith. 2009. Mixed effects models and extensions in ecology with R. Springer-Verlag, New York. 574 p.

