0
$\begingroup$

I am attempting to analyse the categorical overlap of a dataset to ultimately ascertain the optimal way of categorising the data to minimise the amount of used categories to describe the dataset.

Strategy that I am trying to employ:

  1. map out all combination of "overlaps" with items and "independent" to identify items and count. ("independent" = items from a category not referred to by other categories)
  2. out of the above combinations, identify duplicate data categories (ie. categories that is made up of 100% overlaps with other category/combination of full categories)
  3. output: unique number of these combinations, netting out duplicated categories will be the minimum amount of categories required to describe the data.
  4. itemised output: will be used to investigate further pruning of categorisation to identify small combinations that can potentially be rolled into a bigger category.

Effort thus far:

I am relatively new to R and python and have been doing a bulk of these in Excel.

  • I have been able to derive a square matrix to analyse 1° of overlap (ie. #items overlapping per pair of categories) following the advise in Category Overlap Analysis question .
  • unpivoting the matrix to derive an output that was used to analyse overlaps per pair of categories and identify duplication that exists for 1° overlaps. Through this analysis I am able to identify 300 duplicated 1° categorical overlaps which can be resolved to 118 unique categories.

short coming of the method above:

  • inability to identify item count for higher order of overlaps
  • does not produce an itemised output for each combination of "overlaps"/"independent"

Question:

  1. is there a scientific name of this type of analysis (potentially use this to update the title of this question and to do further research on the best method to do this)
  2. is there a better/easier (more scalable, efficient and effective) way to do this than what I am doing?

EDIT Example to better illustrate what I am having difficulties attempting to achieve.

Data snippet

Category, ItemCode
G0617,5410.001
G0617,5410.006
G0617,5410.903
...
G0080,5410.001
...
G0419,5410.001
...
G0532,5410.001
G0532,5410.903
...
G0616,5410.006
...
G0659,5410.001
G0659,5410.903
...
G0846,5410.001
...
Gtest,5410.903
Gtest,5410.006

enter image description here

Ideal output

category|equivalent categories|subsumed categories|independent item_code|duplicated category
G0080|||5410.001|
G0419|G0080|||TRUE
G0532||G0080|5410.903|
G0616|||5410.006|
G0617|G0532,G0616;G0080,Gtest;G0532,Gtest|G0080,G0419,G0532,G0616,G0659,G0846||
G0659|G0532|G0080|5410.903|TRUE
G0846|G0080|||TRUE
Gtest||G0616|5410.903|

Ideal Output in a worksheet

Duplicated category will be biased towards category ID with smaller #. (ie. Where same categories are exactly the same, the category with higher ID will be marked as a duplicate of the category with the smallest ID. This example, G0419 and G0846 are both marked as duplicates of G0080)


Modified overlap function to identify category that is fully represented by its subsumed categories and remove subsumed relationship relating to identical categories. new plot

overlaps = function(ta,row=T,sub=F){ ## Takes a dichotomous table and computes the overlap
  
  ## init variables ----
  if(row==F){ta=t(ta)}
  ncas = dim(ta)[1]
  outmat = matrix(0,nrow=ncas,ncol=ncas)
  
  ilist = list()
  slist = list()
  ## loop through rmat to establish equality & subsumation ----
  for(n1 in 1:ncas){View
    ilist[[n1]]=c(NA)
    slist[[n1]]=c(NA)
    for(n2 in 1:ncas){
      if(n1!=n2){
        d = ta[n1,]-ta[n2,]
        if(min(d)==max(d)){
          outmat[n1,n2]=1 ## Equality
          t_list<- c(ilist[[n1]],n2,n1)
          ilist[[n1]]= t_list[which.min(t_list)]
        }else if(min(d)==0 & max(ta[n2,]>0)){
          outmat[n1,n2]=2 ## Subsuming
          slist[[n1]]=c(slist[[n1]],n2)
        } 
      }
    }
  }
  
  rownames(outmat)=colnames(outmat)=rownames(ta) #headers
  
  ## loop through slist to remove trivial relationships and identify equality through subsumed categories ----
  if(!sub){ ## remove indirectly subsumed categories (ie. trivial relationship A -> C in A -> B -> C)
    
    ta_agg <- matrix(0, nrow=1,ncol=dim(ta)[2]) ## setup matrix for agg rmat of each item in list
    item_list = list() ## capture item_code not overlapped in a category
    for(i in 1:length(slist)){
      
      item_list[[i]]=c(NA)
      so = c()
      for(s in slist[[i]]){
        if (!is.na(s)){ ## disregard NAs in list
          so = c(so,slist[[s]])
          ta_agg = ta_agg + ta[rownames(ta)[s],] ## agg rmat for each subsumed item
        }
      }
      
      ta_agg[ta_agg > 1] <- 1 ## replace values > 1 in agg matrix to 1
      d_s = ta[rownames(ta)[i],] - ta_agg
      catsub=F
      if(min(d_s)==max(d_s)){
        catsub = T ## boolean variable to avoid resolving checks on each subsequent for loops 
      } else {
        item_list[[i]] = colnames(ta)[d_s[1,] >= 1] ## retrieve residual item_codes not covered by subsumed categories
        ## not correct. if category is subsumed by another, then item_code is overlapped.
      }
      
      for(s in slist[[i]]){
        if (!is.na(s)){
          if(s %in% so){
            outmat[i,s]=0
          } else if(catsub) {
            outmat[i,s]=3 ## Equality via aggregate of subsumed items
          }
          
          ## loop to remove subsumed identical relationships
          if (!is.na(ilist[[s]])) {
            if (s != ilist[[s]]){
              outmat[i,s] = 0
            } 
          }
        }
      }
      
      ## if category is identical and not oldest/smallest category, remove all non identical relationship
      if(!is.na(ilist[[i]])){
        if (i != ilist[[i]]){
        outmat[i,][outmat[i,] > 1] <- 0
        }
      }
      
    }
  }
  return(outmat)
}
$\endgroup$

1 Answer 1

0
$\begingroup$

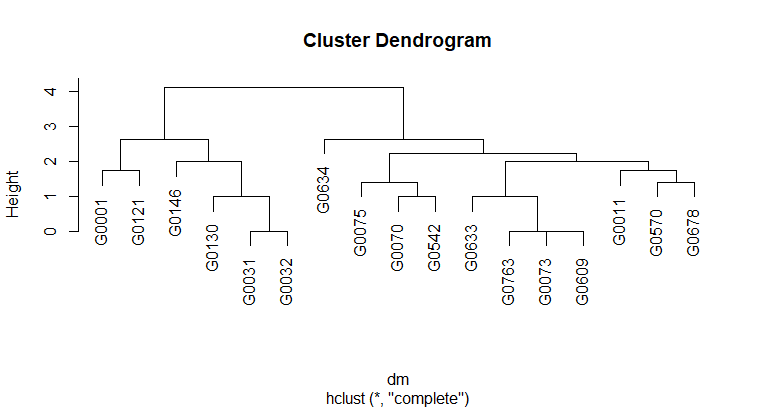
You could use a hierachical cluster analysis to determine the categories that resemble each other most.

I used your data do create the following script that will notify you about the most proximal elements. Note, that I only take the first 100 cases for this example. But it works well with the complete dataset and takes below 1 minute.

## Read your data as a 2-column dataset
d = read.table("relations.txt",header=T,sep=",",stringsAsFactors = F)

d=d[1:100,]

## Create a matrix with all relations
rmat = as.matrix(table(d$category,d$item_code))
dim(rmat)

## Compute a distance matrix and do a hierarchical cluster analysis
dm = dist(rmat)
cl = hclust(dm)


## Set a threshold for distance (as it es "euclidian", the distance is the square root of disagreements)
threshold = 2  ## Less than 4 diverging links

## Get the number of clusters if you cut at this threshold and cut the tree
nclus = length(cl$height)-length(cl$height[cl$height>threshold])
t =cutree(cl,k=nclus)

## Extract all clusters below the threshold
sizes = table(t)
items = t[t %in% names(sizes[sizes>1])]

## Order the items
items = items[order(items)]

## Print the result:
for(c in unique(items)){
  print(paste(names(items[items==c]),collapse="; "))
}

## Plot the tree (only useful if it is small)
plot(cl)

The output of this script for the first 100 cases would be:

[1] "G0031; G0032; G0130"
[1] "G0070; G0542"
[1] "G0073; G0609; G0763"

From this, you can see that the categories 31,32, and 130 are very similar to each other. Just like 70 and 542 or 73,609, and 763. This is also visible in the dendrogram below.

Dendrogram

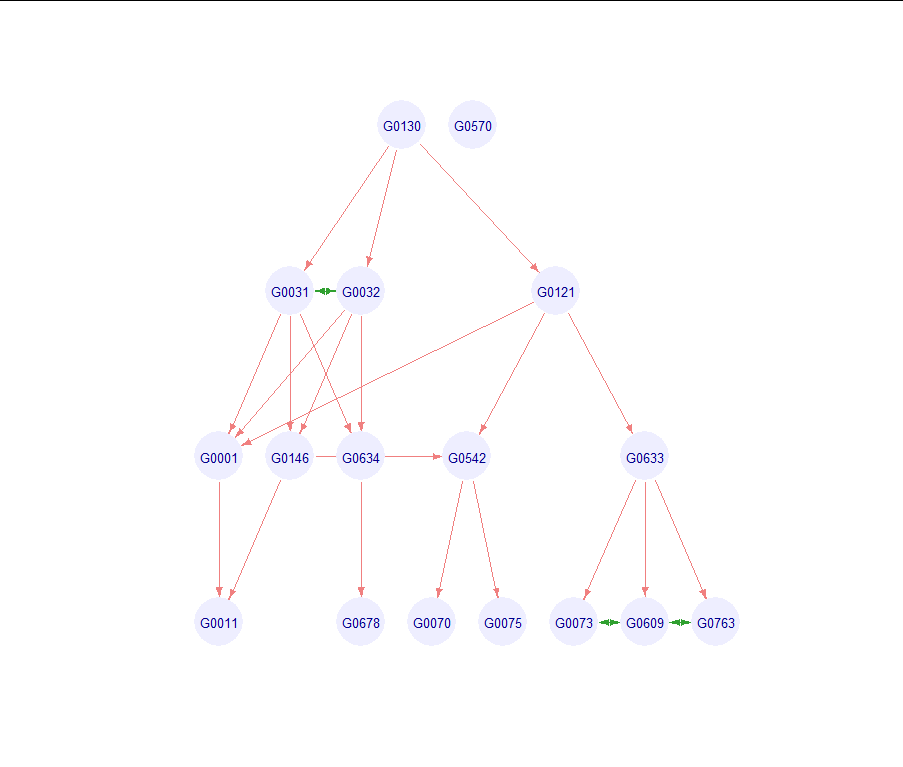
If you need the subsuming categories, a completely different approach may be taken. Here, it would be useful to know the relations between the categories, which may be 'subsuming' and 'identical' and display or store them in a useful manner. For this purpose, I suggest using a graph.

The code below is a function and a short script that starts after the definition of rmat in the first answer. This time, it's not a cluster analysis but the relations between the categories are assessed and stored in a graph object. This may be plotted and analyzed further:

## This is a function to compute all overlaps and subsuming relations.

overlaps = function(ta,row=T,sub=F){ ## Takes a dichotomous table and computes the overlap
  if(row==F){ta=t(ta)}
  ncas = dim(ta)[1]
  outmat = matrix(0,nrow=ncas,ncol=ncas)
  outmat2 = matrix(0,nrow=ncas,ncol=ncas)
  
  ilist = list()
  slist = list()
  for(n1 in 1:ncas){
    ilist[[n1]]=c(NA)
    slist[[n1]]=c(NA)
    for(n2 in 1:ncas){
      if(n1!=n2){
        d = ta[n1,]-ta[n2,]
        if(min(d)==max(d)){
          outmat[n1,n2]=1 ## Equality
          ilist[[n1]]=c(ilist[[n1]],n2)
        }else if(min(d)==0 & max(ta[n2,]>0)){
          outmat[n1,n2]=2 ## Subsuming
          slist[[n1]]=c(slist[[n1]],n2)
        }
      }
      
    }
  }
  rownames(outmat)=colnames(outmat)=rownames(ta)
  
  if(!sub){
    for(i in 1:length(slist)){
      so = c()
      for(s in slist[[i]]){
        so = c(so,slist[[s]])
      }
      for(s in slist[[i]]){
        if(s %in% so){
          outmat[i,s]=0
        }
      }
    }
  }
  return(outmat)
}

###################################################
### Here follows the short script:

library(igraph)
adjmat = overlaps(rmat,sub=F) ## Create an adjacency matrix with the option that subsuming edges are removed

g = graph_from_adjacency_matrix(adjmat, mode="directed",weighted=T) ## Create a graph
g = delete.edges(g,E(g)[E(g)$weight==0]) ## Remove all edges with weight zero (no link)

## Graph cosmetics
E(g)$arrow.size=.5
E(g)$width = 1
E(g)$color = "#30a030"
E(g)$color[E(g)$weight==2] = "#f08080"
V(g)$color = c("#eeeeff")
V(g)$frame.color=NA
V(g)$label.family="Arial"
V(g)$label.cex=.8
V(g)$shape="circle"
V(g)$size=20

chief = rownames(adjmat)[degree(g,mode="in")==0] ## Make the nodes which are not subsumed the root of the tree
l = layout_as_tree(g,root=chief) ## Construct the tree
plot(g,layout=l) ## Plot the tree

The result of this script (again, only for the first 100 elements of your data) would be the following tree representation where red arrows mean 'subsuming' and green arrows mean 'is identical'. So, you see that there is one unique category in these first 100, which is 570. All others are subsumed by 130. Categories 31 and 32, as well as 73, 609, and 763 are identical.

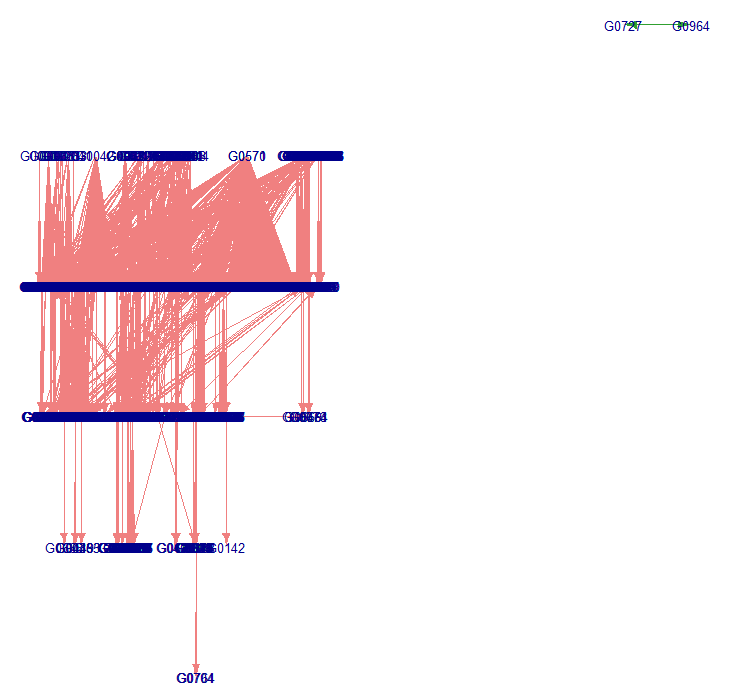
As you can see, this already begins to get complicated. It gets even worse if you try to plot all the data in this way. But the nice thing about graphs is that you can analyze pieces of them and look at detail graphs (elements that are identical, elements with many subsuming elements...). Probably your categories even make sense to you, which would make the exploration easier.

enter image description here

This would be the complete graph. From this, you can only gather that 727 and 964 are identical and don't have any connection to the others. Everything else is a blur.

enter image description here

$\endgroup$
10
  • $\begingroup$ Thank you for your response @MartinWettstein. Hierarchical Cluster Analysis is a new concept to me. After briefly reading about this, I understood this to be grouping based on closest distance/fit. Follow-up question: Is there a way to tweak the parameters of the analysis to showcase exact overlaps + "independent" (non-overlaps)? (ie. a single/combination of categories containing all items_codes of another category) $\endgroup$
    – iwinallS
    Commented Aug 15, 2020 at 15:44
  • $\begingroup$ In the default mode, the dist() function just counts the non-overlaps (links only one of a pair has) and draws the square root of this count to determine the distance. If two categories are perfectly overlapping, they have a distance of 0. Are you looking for the case where one category completely subsumes another (contains all links of the other one but probably some more)? $\endgroup$ Commented Aug 16, 2020 at 11:17
  • $\begingroup$ Thanks @MartinWettstein. Thank you for the dist() clarification. I am completely new to this, is there a way to filter this analysis to focus on those with dist() = 0.? Yes, I am also looking for cases where one category completely subsumes another and was able to identify these in my basic analysis. I am however struggling to identify if a category is fully (no more, no less) made up of other categories. Understanding each dist() describes the overlap of 1 category to another, anyway we can utilise this to infer the relationship I am struggling to identify? $\endgroup$
    – iwinallS
    Commented Aug 17, 2020 at 4:24
  • $\begingroup$ I looked some closer at your data and found that you have a lot of identical and subsuming categories. With this mass of special cases, it would be best to inspect the relations between the categories in a network graph where you can trace the subsumations and equalities. I'll get back to you when I found an easy way to do so. $\endgroup$ Commented Aug 17, 2020 at 9:47
  • $\begingroup$ @iwinallS: The most recent edit now covers the subsumations. You can see that it gets messy. But I'm sure the data in the graph can be used to dig for the information you want to get. $\endgroup$ Commented Aug 17, 2020 at 12:25

Your Answer

By clicking “Post Your Answer”, you agree to our terms of service and acknowledge you have read our privacy policy.

Not the answer you're looking for? Browse other questions tagged or ask your own question.