So I am trying to build a logistic regression model on a data set (Full notebook here).
I am still figuring out this data set, so I wanted to fit a logistic regression on the entire dataset, and then evaluate the residuals in order to analyze the samples that my model is not able to classify correctly (Maybe check if they are outliers or or reach the conclusion that a linear model is not appropriate and that I need something like a tree or wtv).
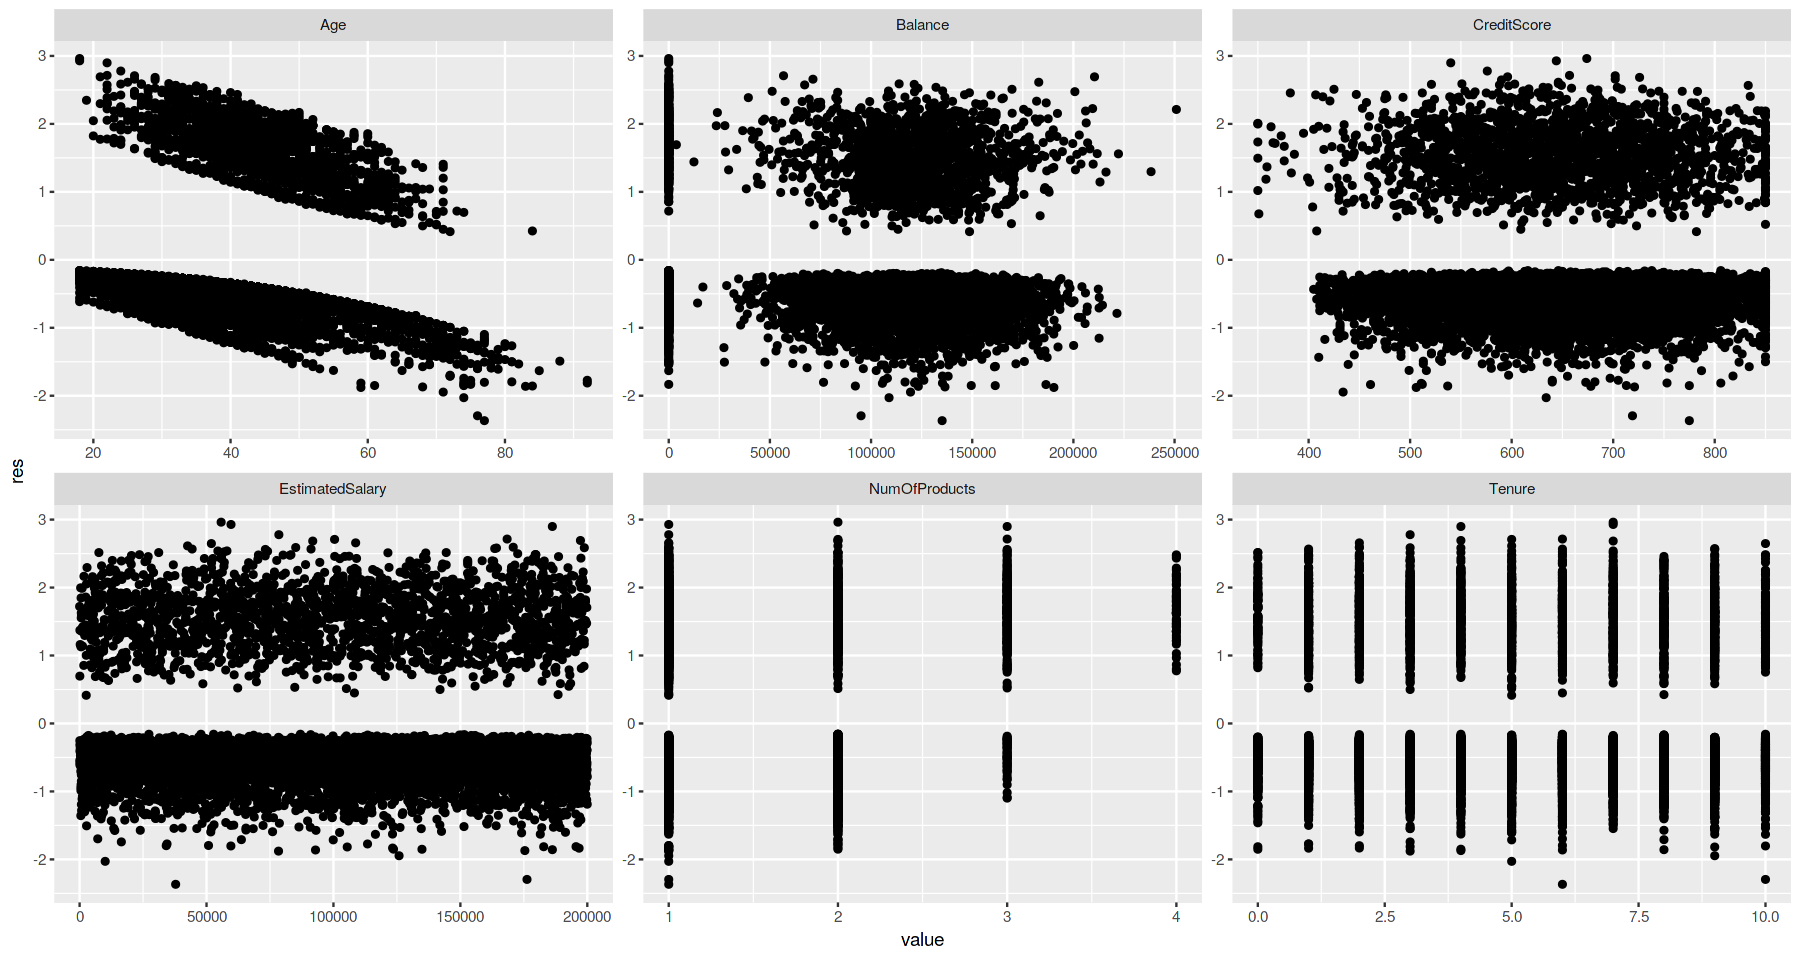
One of the things that I want to do is see how the residuals vary with the predictors, so I made a plot for the continuous predictors:

and also categorical or binary predictors as well as the label (Exited):

My idea was to identify the points with the highest residuals and try to understand why they are being so classified (Maybe they are outliers?).
The thing is, I can't understand the value of these residuals. Why do I have residuals values that are greater than 1 or lower than 0, given that what I am trying to predict is a binary column with zeros and ones, and how is it that I have two distinct zones in the continuous plots? How would you interpret these residuals (if at all)?
For example, in the categorical plots it makes it clear to me that Females and residents in Germany more difficult to classify (They have higher boxes).
Is this sort of analysis something that you?
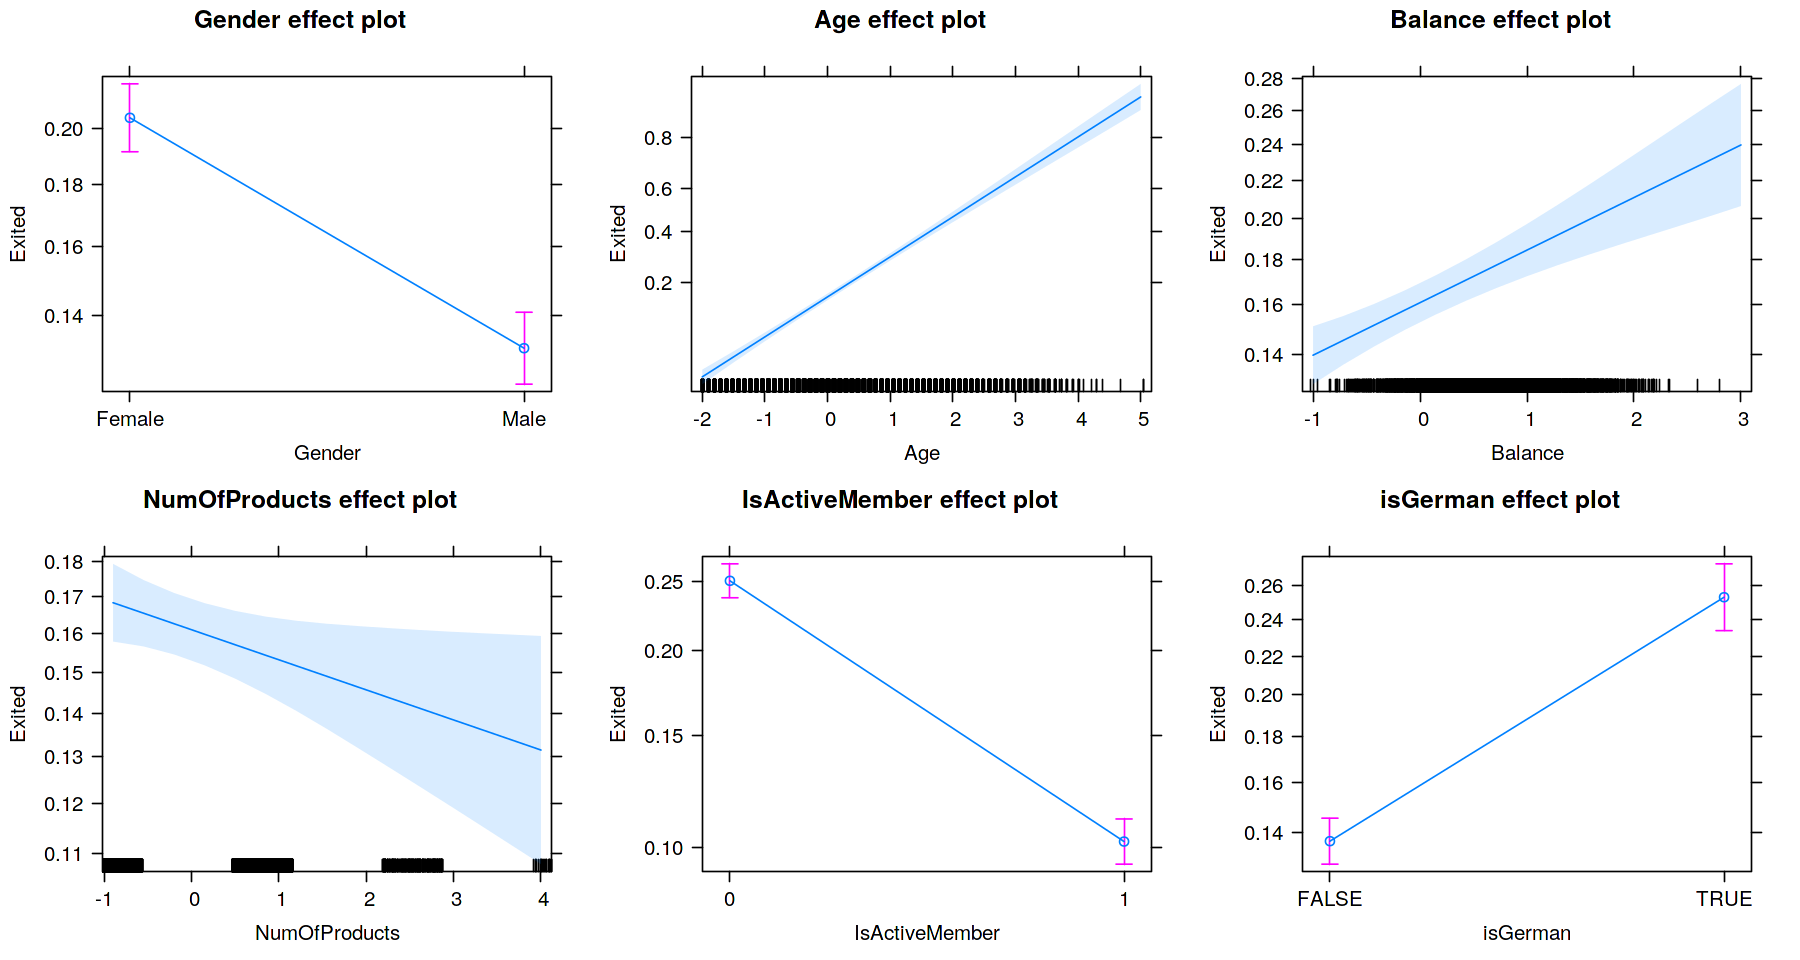
I also found this package called effects that can plot this:

However, I am so far unable to understand how is it that these effects plots are calculated. Can anybody here explain how such plots are made and what the biggest conclusions that you can draw from them?
In general terms, how is your approach when fitting a binary classifier? Do you follow something like this or do you do it in an entire different way?
Thank you!
