1
$\begingroup$

I have a vector of positive integer counts taken from a time-series (365 observations/days).

I believe that there is variance in these counts due to the day of week they are observed and as I am looking for abnormal observations I'd like to remove this variance before placing a threshold on what is abnormal.

I have tried creating a vector of days (1-7) which goes from t1 to t365 and counting the activity on those days. I then divided each of the count observations by the activity for that day.

Is this the right approach and how do I measure the strength of the correlation?

(I have looked at point-biserial correlation but is that just for binary categories?)

Ultimately I would like to see how much of the variance in the discrete vector is explained by the day of the week.

$\endgroup$

2 Answers 2

0
$\begingroup$

Look into generalized linear models. You have a binomial or possibly Poisson dependent. What you will need to do is convert your categorical IV into indicator vars. Put another way, you will need to do an ANOVA using a non-normal DV. This is quite easy these days. In SAS, you use GENMOD.

$\endgroup$
1
$\begingroup$

How about this. Let's make up some data where there really is a day effect

## dates of each day of 2012
days2012 <- seq(as.Date("2012-01-01"), as.Date("2012-12-31"), by="day")

## make variables representing interesting temporal units
dta <- data.frame(date=days2012, day=weekdays(days2012), month=months(days2012))

## specify average rates that are higher on Wednesdays
dta$muY <- ifelse(dta$day=='Wednesday', 10, 5)

## generate random count data from average rates  
dta$Y <- rpois(rep(1, nrow(dta)), dta$muY)

To spot the fact that Wednesdays are special in this data set you can use a generalised linear model. This one asks whether rates vary by month or day or both:

mod <- glm(Y ~ day + month, data=dta, family=poisson)
summary(mod)

which gives a nice big effect for the dummy variable that represents Wednesday.

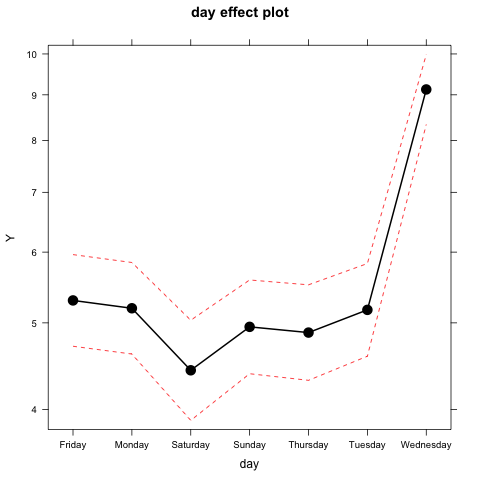
To avoid the dummy variable contrasts obscuring the interpretation you can look at the marginal effects

library(effects) 
plot(effect("day", mod))

which again gives a big spike for Wednesday while operating on the scale of the observed counts.

enter image description here

$\endgroup$
5
  • $\begingroup$ Thanks for this @conjugateprior, very nice example. When I run this code, Friday is not in the results variable mod. Does that happen for you too? I am using R version 2.15 $\endgroup$
    – dsimmie
    Commented Jan 30, 2013 at 17:48
  • $\begingroup$ R's default contrast coding chooses a baseline category for each factor in the model on alphabetical grounds. Here the baseline day is Friday and the baseline month is April. That means that the constant term in this model is the rate for Fridays in April and the coefficients are added to/subtracted from this. (Every regression model will do something like this). $\endgroup$ Commented Jan 31, 2013 at 9:27
  • $\begingroup$ One solution is to look at marginal effects instead. I've adjusted to answer to reflect this. $\endgroup$ Commented Jan 31, 2013 at 10:12
  • $\begingroup$ @dsimmie Forgot the (a) to ensure you actually see the comments above. $\endgroup$ Commented Jan 31, 2013 at 10:22
  • $\begingroup$ Thanks for the explanation and the addition of the graph/marginal section. I will look into regression in more detail now. The results from my glm suggest that the relationship is not as strong as I thought with none of the days having a significant z statistic. $\endgroup$
    – dsimmie
    Commented Jan 31, 2013 at 21:02

Your Answer

By clicking “Post Your Answer”, you agree to our terms of service and acknowledge you have read our privacy policy.

Not the answer you're looking for? Browse other questions tagged or ask your own question.