33
$\begingroup$

I have a classifier that I'm doing cross-validation on, along with a hundred or so features that I'm doing forward selection on to find optimal combinations of features. I also compare this against running the same experiments with PCA, where I take the potential features, apply SVD, transform the original signals onto the new coordinate space, and use the top $k$ features in my forward selection process.

My intuition was that PCA would improve the results, as the signals would be more "informative" than the original features. Is my naive understanding of PCA leading me into trouble? Can anyone suggest some of the common reasons why PCA may improve results in some situations, but worsen them in others?

$\endgroup$
6
  • $\begingroup$ Can your question be summarized like this?: "What's better - to build classifiers based on the original variables or on a few principal components extracted from those?" $\endgroup$
    – ttnphns
    Commented Mar 20, 2013 at 0:02
  • 1
    $\begingroup$ I would say more along the lines of, "Are there situations when it is better to use the original variables vs. a few principle components extracted from those?" $\endgroup$ Commented Mar 20, 2013 at 0:11
  • 1
    $\begingroup$ There are many classification techiques. If for example take Discriminant analysis, I'd recommend you to read this post (including my own comment there). $\endgroup$
    – ttnphns
    Commented Mar 20, 2013 at 0:32
  • 1
    $\begingroup$ What do you mean by 'results of a classifier'? If it is proportion classified correctly, this is a discontinuous improper scoring rule, i.e., an accuracy score that is optimized by a bogus model. I would suggest using a proper accuracy scoring rule, to start with. $\endgroup$ Commented May 28, 2013 at 16:21
  • 1
    $\begingroup$ Bit late for the party, but: the first thing I'd double check is that the validation results of the forward selection were actually obtained with independent cases. Otherwise, you'd likely be subject to a huge optimistic bias. $\endgroup$
    – cbeleites
    Commented Nov 25, 2013 at 12:44

5 Answers 5

34
$\begingroup$

Consider a simple case, lifted from a terrific and undervalued article "A Note on the Use of Principal Components in Regression ".

Suppose you only have two (scaled and de-meaned) features, denote them $x_1$ and $x_2$ with positive correlation equal to 0.5, aligned in $X$, and a third response variable $Y$ you wish to classify. Suppose that the classification of $Y$ is fully determined by the sign of $x_1 - x_2$.

Performing PCA on $X$ results in the new (ordered by variance) features $[x_1 + x_2, x_1 - x_2]$, since $\operatorname{Var}( x_1 + x_2 ) = 1 + 1 + 2\rho > \operatorname{Var}(x_1 - x_2 ) = 2 - 2\rho$. Therefore, if you reduce your dimension to 1 i.e. the first principal component, you are throwing away the exact solution to your classification!

The problem occurs because PCA is agnostic to $Y$. Unfortunately, one cannot include $Y$ in the PCA either as this will result in data leakage.


Data leakage is when your matrix $X$ is constructed using the target predictors in question, hence any predictions out-of-sample will be impossible.

For example: in financial time series, trying to predict the European end-of-day close, which occurs at 11:00am EST, using American end-of-day closes, at 4:00pm EST, is data leakage since the American closes, which occur hours later, have incorporated the prices of European closes.

$\endgroup$
10
  • 3
    $\begingroup$ what is "data leakage"? $\endgroup$
    – user603
    Commented Mar 20, 2013 at 10:20
  • $\begingroup$ @Wayne costly too haha $\endgroup$ Commented Mar 20, 2013 at 14:36
  • $\begingroup$ (-1) for causing confusion: (1) PCA is unsupervised, so it will never include Y in claculating the transformation. The corresponding supervised technique is PLS, which uses both X and Y. (2) Data leakage (as in: testing with statistically dependent data) does not follow per se from using a supervised method. On the contrary: it will occur with PCA just the same as with PLS if you do not obey the rule that from the first analysis step that uses more than one case (e.g. centering, scaling, PCA/PLS projection) on all calculations have to be done on the training data only (i.e. need to be ... $\endgroup$
    – cbeleites
    Commented Nov 25, 2013 at 12:37
  • $\begingroup$ ... recalculated for each of the surrogate models. The results of these calculations can then be applied to the test data, i.e. subtract the center obtained from the training data, rotate by the rotation obtained by PCA on the training cases, etc. $\endgroup$
    – cbeleites
    Commented Nov 25, 2013 at 12:39
  • 1
    $\begingroup$ As for the example: time series are particularly difficult, as what constitutes an independent case will depend very much on the application. See e.g. stats.stackexchange.com/questions/76376/… $\endgroup$
    – cbeleites
    Commented Nov 25, 2013 at 12:42
29
$\begingroup$

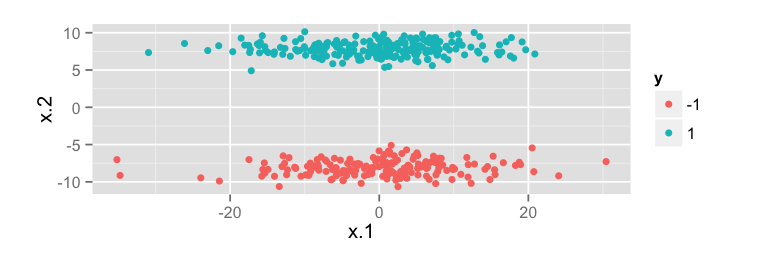
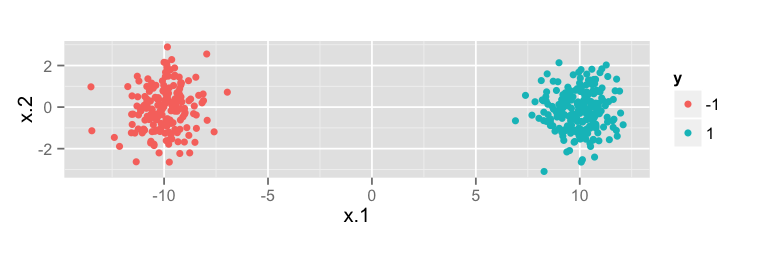
There is a simple geometric explanation. Try the following example in R and recall that the first principal component maximizes variance.

library(ggplot2)

n <- 400
z <- matrix(rnorm(n * 2), nrow = n, ncol = 2)
y <- sample(c(-1,1), size = n, replace = TRUE)

# PCA helps
df.good <- data.frame(
    y = as.factor(y), 
    x = z + tcrossprod(y, c(10, 0))
)
qplot(x.1, x.2, data = df.good, color = y) + coord_equal()

# PCA hurts
df.bad <- data.frame(
    y = as.factor(y), 
    x = z %*% diag(c(10, 1), 2, 2) + tcrossprod(y, c(0, 8))
)
qplot(x.1, x.2, data = df.bad, color = y) + coord_equal()

PCA Helps

PCA helps

The direction of maximal variance is horizontal, and the classes are separated horizontally.

PCA Hurts

PCA hurts

The direction of maximal variance is horizontal, but the classes are separated vertically

$\endgroup$
1
  • 2
    $\begingroup$ ... and in example 2, the supervised analogon, PLS would actually help. $\endgroup$
    – cbeleites
    Commented Nov 25, 2013 at 12:43
15
$\begingroup$

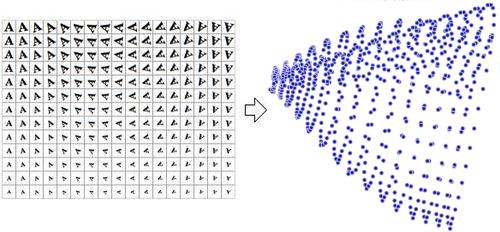
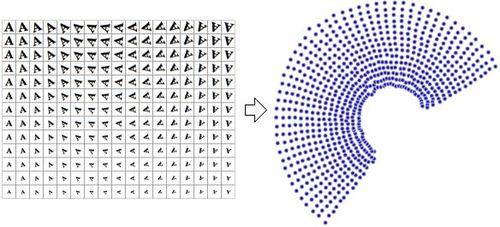
PCA is linear, It hurts when you want to see non linear dependencies.

PCA on images as vectors: enter image description here

A non linear algorithm (NLDR) wich reduced images to 2 dimensions, rotation and scale:

enter image description here

More informations: http://en.wikipedia.org/wiki/Nonlinear_dimensionality_reduction

$\endgroup$
0
5
$\begingroup$

Suppose a simple case with 3 independent variables $x_1,x_2,x_3$ and the output $y$ and suppose now that $x_3=y$ and so you should be able to get a 0 error model.

Suppose now that in the training set the variation of $y$ is very small and so also the variation of $x_3$.

Now if you run PCA and you decide to select only 2 variables you will obtain a combination of $x_1$ and $x_2$. So the information of $x_3$ that was the only variable able to explain $y$ is lost.

$\endgroup$
5
$\begingroup$

I see the question already has an accepted answer but wanted to share this paper that talks about using PCA for feature transformation before classification.

The take-home message (which is visualised beautifully in @vqv's answer) is:

Principal Component Analysis (PCA) is based on extracting the axes on which data shows the highest variability. Although PCA “spreads out” data in the new basis, and can be of great help in unsupervised learning, there is no guarantee that the new axes are consistent with the discriminatory features in a (supervised) classification problem.

For those interested, if you look at Section 4. Experimental results, they compare the classification accuracies with 1) the original features, 2) PCA transformed features, and 3) combination of both, which was something that was new to me.

My conclusion:

PCA-based feature transformations allow to summarize the information from a large number of features into a limited number of components, i.e. linear combinations of the original features. However the principal components are often difficult to interpret (not intuitive), and as the empirical results in this paper indicate they usually do not improve the classification performance.

P.S: I note that one of the limitations of the paper that sould have been listed was the fact that the authors limited performance assessment of the classifiers to 'accuracy' only, which can be a very biased performance indicator.

$\endgroup$

Your Answer

By clicking “Post Your Answer”, you agree to our terms of service and acknowledge you have read our privacy policy.

Not the answer you're looking for? Browse other questions tagged or ask your own question.