2
$\begingroup$

I have a question about emmeans

  • Variables are A = {a1, a2, a3}, B= {b1, b2}, C = {c1, c2}
  • Model ~ A+B+C+A * B+A * C+C * B
  • One of research questions: Is there an effect of C on a1, a2 und a3 (A)?

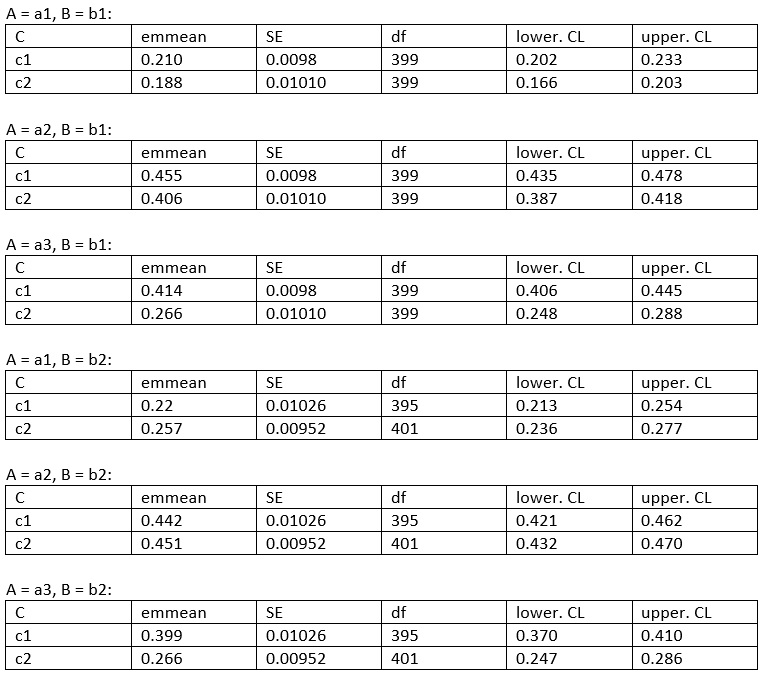
And I was doing an analysis with > emmeans (Model, ~C|A+B) cause I needed to do also with "pairs" (for contrast analysis)

Also emmeans is for "mean" and pairs is for "comparison of mean" I can interpret and report values for pairs cause there are t-values and p-values ex. t(45) = 0.35, p = .003. The effect of C is significant

But I don't get it to interpret emmeans. How can I interpret this table and report the values? Could you please explain how I can do?

enter image description here

$\endgroup$

1 Answer 1

1
$\begingroup$

A comprehensive overview van be found here: https://cran.r-project.org/web/packages/emmeans/vignettes/interactions.html

Calling emmeans(Model, simple = "each") will give you a straightforward table with each possible combination of your factors. Be careful in jumping in with calling complex contrast without first visualizing your results; you might overlook crucial interaction impacts, potentially rendering your interpretation invalid.

BTW, which package have you used for fitting the model? Typically, the notation e.g. A*B entails both main effect and interaction (A+B+A:B), so verify your model formulation.

$\endgroup$
6
  • $\begingroup$ Thanks a lot before posting this question I have already tried to find for this with Google and I read what you linked before that. Nevertheless I cannot get it how to interpret so I did post this question well, I will try to keep working with that... And about your question, yes you're right I meant Model ~ A+B+C+A:B+A:C+C:B :) Thanks for your answer! $\endgroup$
    – Taede17
    Commented Aug 13, 2021 at 13:37
  • $\begingroup$ You get a comparison of the estimated marginal means. What is the interpretation problem, precisely? $\endgroup$
    – KrisBae
    Commented Aug 13, 2021 at 21:16
  • $\begingroup$ Cause I have never had experience with emmeans so I don't know even how I should report this ex. with t-test I know that I should report so; t(35) = 5.76, p = .007 and this tell us that the factor A has an effect and this is significant but with emmeans what I know exactly is emmeans tell us mean values that's all. I just want to learn how I should report with values from emmeans table and which values are important for report. You wrote "you get a comparison of the estimated marginal means" I cannot interpret or understand the table just with your comment. I am just trying to learn. Thanks $\endgroup$
    – Taede17
    Commented Aug 14, 2021 at 2:11
  • 1
    $\begingroup$ The issue really isn't with understanding the software. I think you need to talk to a statistical consultant. Check with a stat or biostat dept near you. $\endgroup$
    – Russ Lenth
    Commented Aug 15, 2021 at 13:22
  • $\begingroup$ I think what was meant in this answer was pairs(emmeans(Model, ~ A*B*C), simple = "each"). This will show pairwise. comparisons of each factor, broken down by the other two factors. $\endgroup$
    – Russ Lenth
    Commented Aug 16, 2021 at 2:33

Your Answer

By clicking “Post Your Answer”, you agree to our terms of service and acknowledge you have read our privacy policy.

Not the answer you're looking for? Browse other questions tagged or ask your own question.