3
$\begingroup$

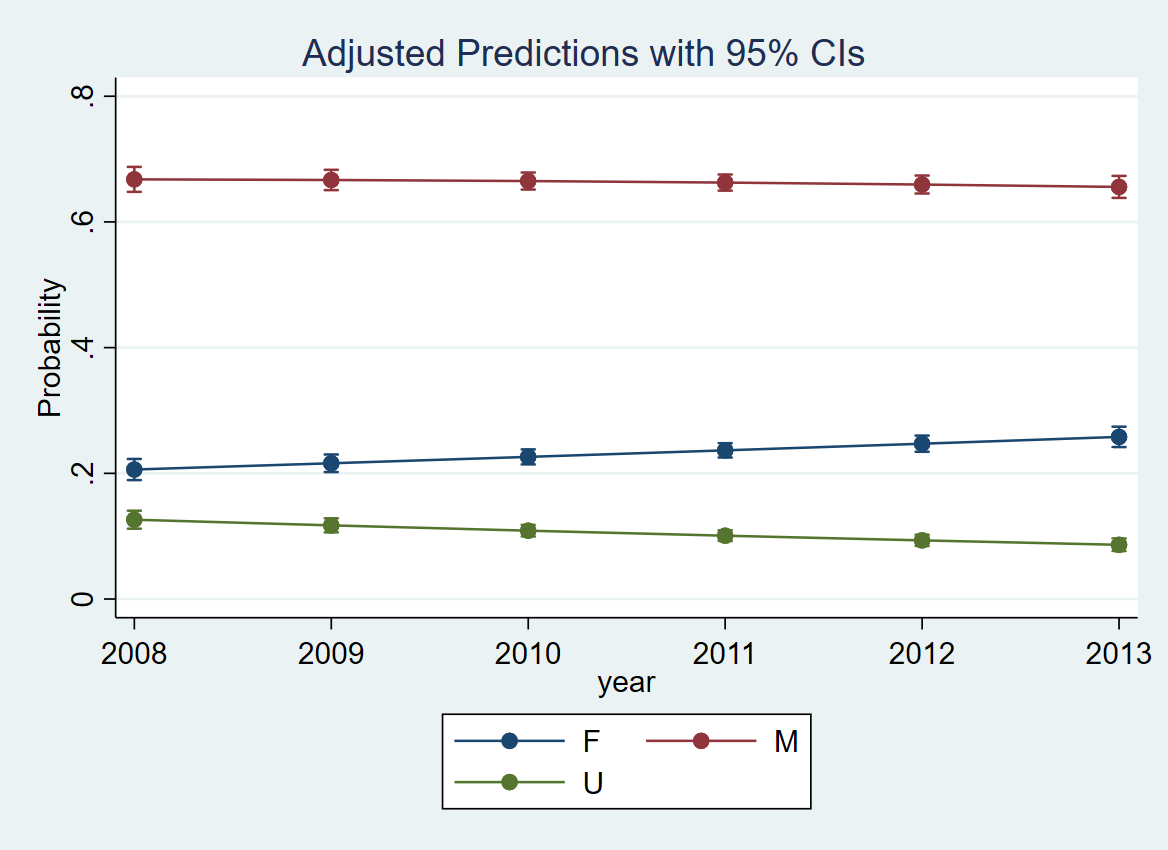
I produced the below plot of predicted probabilities after running a multinomial logit model with Stata (full code below). Questions:

  1. In 2013 (for example), the 95% CIs for M, F, and U do not overlap. Can I therefore conclude that the expected probabilities are statistically significantly different (at 5% level) for these 3 groups?

  2. For the F group the CIs do not overlap for 2013 v 2008. Can I conclude the predicted probabilities are statistically significant (5% level) for those 2 years?

I understand if the CIs do overlap, they may or may not be statistically significantly different.

Code:

mlogit gender_n year, vce(cluster person)
margins, at(year = (2008(1)2013))
marginsplot

Plot:

enter image description here

Note: cross posted to Statalist but no responses.

$\endgroup$
1
  • $\begingroup$ I posted an answer to your question, but in your graph the distance relative to the confidence intervals is such large that the question is only a technical issue that is not relevant for this case where the differences are very clear. $\endgroup$ Commented Sep 30, 2021 at 17:40

2 Answers 2

3
+50
$\begingroup$

If the 95% confidence intervals for two estimates do not overlap, you can say the two estimates are significantly different, $p < .05$ at least. There are cases where this may not be true, for instance when there is covariance between the estimates, but that shouldn't be the case here, assuming F, M, and U are different groups.

However:

  • It would be better to examine the parameter estimates for your model to find, for instance, the estimated difference between F and U in 2008, the standard error for that difference, and the associated p value.
  • I don't know Stata, but you should probably double check that this plot shows confidence intervals and not standard errors (which are about half as wide). It looks like the CIs wouldn't overlap even if these turned out to be standard errors, but good to check!
  • If you want to compare specific years here, and didn't plan in advance which two years to compare, you should probably be correcting for multiple comparisons.
$\endgroup$
1
  • $\begingroup$ TY Eoin! This is extremely helpful. You are right in that F, M, and U are separate groups - the same person would not be in more than one group. That's very useful about correcting for the multiple comparisons. I will probably just compare the last and first year, but also look at the trend. Trend will be defined as the average marginal effects for the variable "year" (the difference in the probability of a particular outcome when year increases by 1 unit) => and if the p-value is <0.05 for the marginal effects of that variable will consider it to be a "statistically significant" trend. $\endgroup$
    – Marissa
    Commented Sep 28, 2021 at 23:38
2
$\begingroup$

A similar question (asking sort of the opposite, what if intervals are overlapping) occured here Why is mean ± 2*SEM (95% confidence interval) overlapping, but the p-value is 0.05?

Making comparisons on standard errors or confidence intervals is a rule of thumb using

$$z_{overlap} = \frac{\vert \bar{X}_1- \bar{X}_2 \vert}{SE_1+SE_2} \geq 2$$

whereas the t-value is more accurate

$$t = \frac{\bar{X}_1 - \bar{X}_2}{\sqrt{SE_1^2+SE_2^2}}$$

Typically you get $z_{overlap}<t$ and it underestimates the distance and overestimates the p-value. So even when the intervals are just overlapping, the 'correct' difference (the $t$ value) might be larger and the p-value smaller than 5%. And if the intervals are not overlapping than the p-value will be even smaller.

If the confidence intervals are not overlapping then the $t$ value will be even larger than 2, and the p-value should be below 5%.

Exceptions In the answer to that question two exceptions where mentioned

  • In the case of the pooled variance, you might have a situation - although it is rare - that the variance of the larger sample is larger than the variance of the smaller sample, and then it is possible that $t<z_{overlap}$.

  • Instead of z-values and a z-test you are actually doing (should be doing) a t-test. So it might be that the levels on which you base the confidence intervals for the error bars (like '95% is equivalent to 2 times the standard error') will be different for the t-test. To be fair, to compare apples with apples, you should use the same standard and base the confidence levels for the error bars on a t-test as well. So let's assume that also for the t-test the boundary level that relates to 95% is equal to or less than 2 (this is the case for sample sizes larger than 60).

These are the exceptions, when we can not conclude with certainty that the p-value is less than 5% when 95% confidence intervals are not overlapping.
$\endgroup$
1
  • $\begingroup$ That you very much for this!! This is very helpful as well! $\endgroup$
    – Marissa
    Commented Oct 2, 2021 at 18:11

Your Answer

By clicking “Post Your Answer”, you agree to our terms of service and acknowledge you have read our privacy policy.

Not the answer you're looking for? Browse other questions tagged or ask your own question.