I have data as two lists:
acol = [8.48, 9.82, 9.66, 9.81, 9.23, 10.35, 10.08, 11.05, 8.63, 9.52, 10.88, 10.05, 10.45, 10.0, 9.97, 12.02, 11.48, 9.53, 9.98, 10.69, 10.29, 9.74, 8.92, 11.94, 9.04, 11.42, 8.88, 10.62, 9.38, 12.56, 10.53, 9.4, 11.53, 8.23, 12.09, 9.37, 11.17, 11.33, 10.49, 8.32, 11.29, 10.31, 9.94, 10.27, 9.98, 10.05, 10.07, 10.03, 9.12, 11.56, 10.88, 10.3, 11.32, 8.09, 9.34, 10.46, 9.35, 11.82, 10.29, 9.81, 7.92, 7.84, 12.22, 10.42, 10.45, 9.33, 8.24, 8.69, 10.31, 11.29, 9.31, 9.93, 8.21, 10.32, 9.72, 8.95, 9.49, 8.11, 8.33, 10.41, 8.38, 10.31, 10.33, 8.83, 7.84, 8.11, 11.11, 9.41, 9.32, 9.42, 10.57, 9.74, 11.35, 9.44, 10.53, 10.08, 10.92, 9.72, 7.83, 11.09, 8.95, 10.69, 11.85, 10.19, 8.49, 9.93, 10.39, 11.08, 11.27, 8.71, 9.62, 11.75, 8.45, 8.09, 11.54, 9.0, 9.61, 10.82, 10.36, 9.22, 9.36, 10.38, 9.53, 9.2, 10.36, 9.38, 7.68, 9.99, 10.61, 8.81, 10.09, 10.24, 9.21, 10.17, 10.32, 10.41, 8.77]

bcol = [12.48, 9.76, 9.63, 10.86, 11.63, 9.07, 12.01, 9.52, 10.05, 8.66, 10.85, 9.87, 11.14, 10.59, 9.24, 9.85, 9.62, 11.54, 11.1, 9.38, 9.24, 9.68, 10.02, 9.91, 10.66, 9.7, 11.06, 9.27, 9.08, 11.31, 10.9, 10.63, 8.98, 9.81, 9.69, 10.71, 10.43, 10.89, 8.96, 9.74, 8.33, 11.45, 9.61, 9.59, 11.25, 9.44, 10.05, 11.63, 10.16, 11.71, 9.1, 9.53, 9.76, 9.33, 11.53, 11.59, 10.21, 10.68, 8.99, 9.44, 9.82, 10.35, 11.22, 9.05, 9.18, 9.57, 11.43, 9.4, 11.45, 8.39, 11.32, 11.16, 12.47, 11.62, 8.77, 11.34, 11.77, 9.53, 10.54, 8.73, 9.97, 9.98, 10.8, 9.6, 9.6, 9.96, 12.17, 10.01, 8.69, 8.94, 9.24, 9.84, 10.39, 10.65, 9.31, 9.93, 10.41, 8.5, 8.64, 10.23, 9.94, 10.47, 8.95, 10.8, 9.84, 10.26, 11.0, 11.22, 10.72, 9.14, 10.06, 11.52, 10.21, 9.82, 10.81, 10.3, 9.81, 11.48, 8.51, 9.55, 10.41, 12.17, 9.9, 9.07, 10.51, 10.26, 10.62, 10.84, 9.67, 9.75, 8.84, 9.85, 10.41, 9.18, 10.93, 11.41, 9.52]
A summary of the above lists is given below:
N,   Mean, SD,   SEM,   95% CIs
137  9.92  1.08  0.092  (9.74, 10.1)
137  10.2  0.951 0.081  (10.0, 10.3)
An unpaired t-test for the above data gives a p-value of 0.05:
f,p = scipy.stats.ttest_ind(acol, bcol)
print(f, p)
-1.9644209241736 0.050499295018989004
I understand from this and other pages that mean ± 2 * SEM (standard error of mean as calculated by SD/sqrt(N)) gives a 95% confidence interval (CI) range.
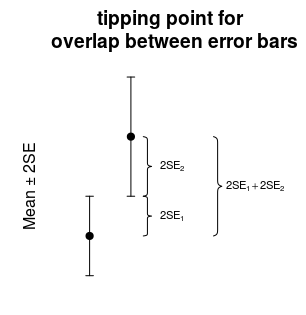
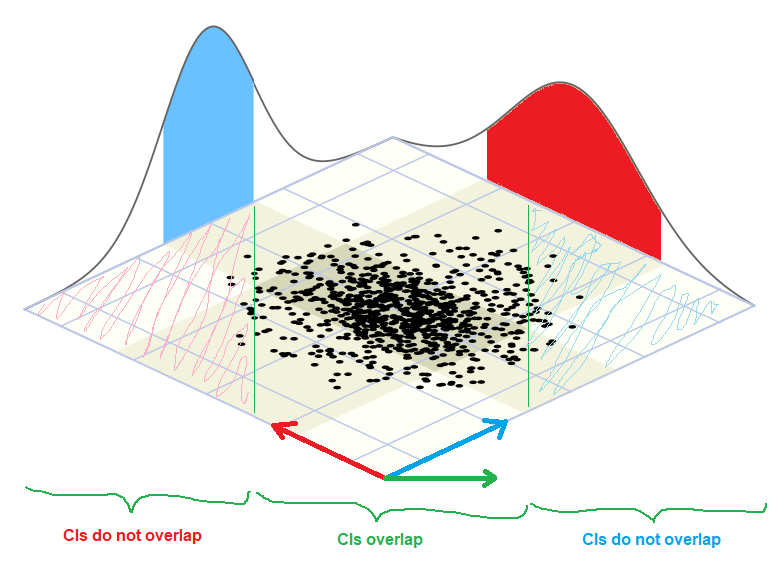
I also believe that if 95% confidence intervals are overlapping, P-value will be > 0.05.
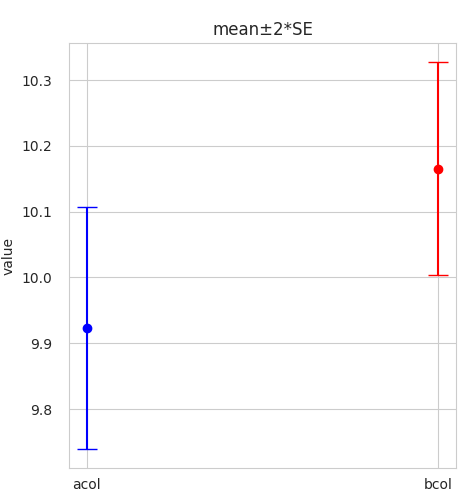
I plotted the above data as mean ± 2 * SEM:
The 95% confidence intervals are overlapping. So why is the p-value reaching a significant level?


