I am a medical doctor working on a project within the field of pharmacokinetics. A lot of detailing is required, so please bear with me.
The aim is to describe the distribution of half-lives of a drug in a population, using data that was not intended for this specific purpose. I would like to know whether my chosen strategy is sound, and I also have some specific questions. I am not a mathematician, so please forgive me if my take on this is non-standard.
Blood samples were collected from hundereds of individuals. Two consecutive blood samples were taken 30 minutes apart from each individual. For simplicity, we name the drug concentrations in the first and second blood sample $C_1$ and $C_2$, respectively, and the time between blood samples $\Delta t$.
We are assuming that the drug is eliminated from blood according to first-order kinetics. As such, the relationship between $C_1$, $C_2$ and $\Delta t$ can be described by a simple exponential decay function:
$$C_2=C_1\cdot e^{-k\cdot \Delta t}$$
In each case, the rate constant $k$ is calculated as follows:
$$k=\frac{\log C_1-\log C_2}{\Delta t}$$
Half-life ($t_{1/2}$) can be calculated from $k$: $$t_{1/2}=\frac{\log 2}{k}$$
The main challenge is that $C_1$ and $C_2$ are subject to a random error, most importantly the imprecision of the chemical analysis used to determine drug concentrations. The coefficient of variation (CV) of the analysis is 9 %, such that each measured value of $C_1$ and $C_2$ can be assumed to be the true value $\pm$18 % (approximately).
In order to check whether there is a significant difference between $C_1$ and $C_2$, the critical difference $D$ was calculated using the method described by C. G. Fraser:
$$D = \sqrt{2}\cdot Z\cdot CV \approx 0.25$$
Z is the Z-score for a bidirectional difference to be significant with p = .05, approximately 1.96. Expressed in words, we assume that there is a true difference between $C_1$ and $C_2$ if their absolute difference is greater than 25 %. In more than 90 % of all cases, there was no significant difference. The mean difference was only 4.4 %.
The most obvious implication of this is that the values of $k$ and $t_{1/2}$ calculated from $C_1$ and $C_2$ in individual cases cannot be trusted to be anywhere near the true values. The distributions of calculated $k$ and $t_{1/2}$ are severely distorted or 'smeared out' compared to the 'true distributions' that we would have found if there were no random error.
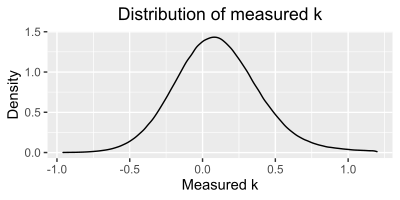
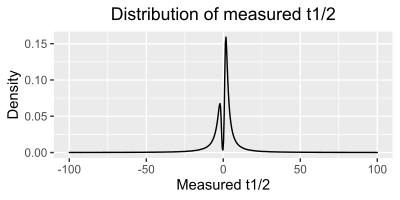
The distribution of calculated ("measured") values look like this (with the x-axes cropped to show the most relevant areas; there were many extreme outliers well beyond what is shown):
$\bar{X}_k \approx 0.120$ and $s_k \approx 0.360$.
$\bar{X}_{t_{1/2}}$ is in fact infinity and $s_{t_{1/2}}$ impossible to calculate due to the presence of infinite values.
We can make some, although very limited, assumptions about the a priori distributions of $k$ and $t_{1/2}$. They must have non-zero, positive values. They are very likely to have marked positive skewness, and especially $t_{1/2}$ is expected to have a substantial right tail. They may be lognormally distributed, but we cannot be sure of this. Based on previous litterature about the drug, $t_{1/2}$ can have values anywhere between 0 and 70, maybe even higher.
Given the analytical CV of 9 % and $\Delta t$ of 0.5 hours, we can simulate e.g. a million calculated values of $k$ if there were no true difference between $C_1$ and $C_2$ and all the observed difference was due to random error. Using R:
(log(rnorm(1000000, 1, .09)) - log(rnorm(1000000, 1, .09))) / .5
The SD of the simulated values, $s_{analytical}$, is 0.257.
Question 1: Assuming that biological variability and analytical imprecision are only two sources of variability of calculated $k$, is it justifiable to calculate the 'biological SD' from the 'total SD' (0.36) and the simulated 'analytical SD' (0.257)?
$$s_{biological} = \sqrt{s_{total}^2-s_{analytical}^2} \approx 0.252$$
Question 2: Is there an easy way to calculate $s_{analytical}$ directly, without using simulation?
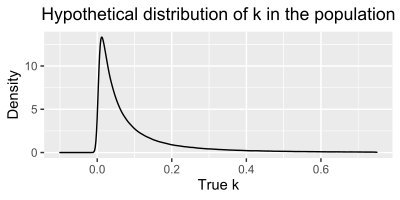
Question 3: Making the crude assumption that $\mu_k = \bar{X}_k = 0.120$ and $\sigma_k = s_{biological} = 0.252$, and that $k$ is lognormally distributed, we get the following distribution of 'true' values of $k$:
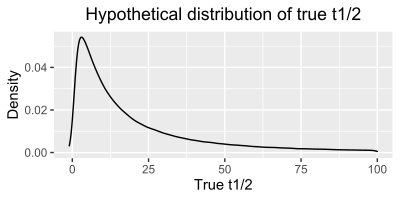
Converting this into $t_{1/2}$ ($\log 2 / k$), we get:
Now, if I simulate a large number of $k$ and $t_{1/2}$, I find that $\mu_{t_{1/2}}\approx 31$ hours. On the other hand, the $t_{1/2}$ corresponding to $\mu_k$ is $\log 2 / 0.12 \approx 5.8$ hours.
What is the mathematical explanation why $\mu_{t_{1/2}}$ is apparently unrelated to $\mu_k$ even though $t_{1/2}$ and $k$ are two sides of the same coin? Despite the fact that $\bar{X}_k$ seems to be a useful approximation of the central tendency of $k$, it is unclear to me what the $t_{1/2}$ calculated from it actually tell us.
Question 4: If all we have is $\bar{X}_k$ and $s_k$ and the only assumption we make about the true values of $k$ or $t_{1/2}$ is that they are positive numbers, can we know anything about the central tendency and spread of $t_{1/2}$ at all?


