2
$\begingroup$

I'm working on setting up a study that will test how quickly users click on various icons appearing on a computer screen using three different prototype mouse types. Subjects will visit on three three days and perform the test twice each visit (two recorded time measurements per visit).

I want to show there is no difference in time within subjects and between mouse devices via equivalence testing.

Let's say I have 135 subjects. I could assign 45 subjects to a specific mouse device and only have them use that particular device each visit. Or I could assign them a different mouse device each visit.

Which design would be better? I believe it depends on the variability between mouse devices. Also, how would I analyze the equivalence testing in one model that takes into account the user effect and mouse device effect?

$\endgroup$
6
  • 1
    $\begingroup$ These numbers are quite low for equivalence testing. I suggest you prepare in advance two sets of methods - one based on equivalence and one on significance (with indifference region), which should suffice. $\endgroup$
    – Spätzle
    Commented Oct 21, 2021 at 21:33
  • $\begingroup$ @Spätzle Could you expand on significance with indifference region? I updated the question to 135 subjects as I want the question to focus on study design and analysis, not sample size. $\endgroup$
    – Glen
    Commented Oct 21, 2021 at 22:33
  • $\begingroup$ I would recommend using uniformly most powerful tests for equivalence, a la Wellek's textbook: definitely more powerful than TOST. $\endgroup$
    – Alexis
    Commented Nov 10, 2021 at 0:30
  • $\begingroup$ @Alexis do you have an online reference? $\endgroup$
    – Glen
    Commented Nov 10, 2021 at 13:31
  • $\begingroup$ @Glen Wellek's is the only textbook I have seen, and it pulls not only from his experience, but from a widely distributed literature. I found it digitally accessible from my local public library, and from my university library, which also had a print copy if I recall correctly. However, you might also try Inter-Library Loan if your local library participates in that exchange (which, during COVID-19 realities, may or may not be happening for physical volumes). $\endgroup$
    – Alexis
    Commented Nov 10, 2021 at 16:17

1 Answer 1

2
$\begingroup$

"Usual" significance testing uses null hypothesis $H_0:|\mu_A-\mu_B|=0$. That is, we assume no effect exists. The "acceptance region" (AR, the region in which we do not reject the null) size shrinks as sample size grows. This leads to a super sensitive test, which will reject the null for tiny differences in large sample size.

Using indifference region is a somewhat more "realistic" approach: we acknowledge the possibility that some effect with exist, but we decide to ignore it up to a point, say we ignore effects smaller than $\epsilon$. A relevant null hypothesis would be $H_0:|\mu_A-\mu_B|<\epsilon$. It does help us achieve a more stable approach (in terms of false rejection of the null), but a large enough sample size would eventually lead to rejecting the null. See Section 4.3 of Bickel & Doksum for more details. Do note that the ignorable effect size should be determined before you conduct the test itself - it should be based on results of previous experiments, known measuring error, relevant literature and so on.

Equivalence testing is "flipping" the direction of the hypotheses, i.e $H_0:|\mu_A-\mu_b|\ge\epsilon$. the result is an AR which grows with sample size (up to a bound). The so called "problem" is that it requires a large enough sample size in order to have a large enough AR. Note that for ET, "acceptance" means that we do reject the relevant null htpothesis.

For example, consider the following problem: we have $n$ measurements of $X_A\sim N(\mu_A,1),X_B\sim N(\mu_B,1)$ and we hypothesize the difference of means $\mu_A-\mu_B$. The null hypotheses are as follows:

$$H_0^{sig}:|\mu_A-\mu_B|=0,\qquad H_0^{indiff}:|\mu_A-\mu_B|<\epsilon,\qquad H_0^{equiv}:|\mu_A-\mu_B|>\epsilon$$

We take a vector of size 100, $X\sim N_{100}(0, I)$ and repeat it $2^k$ times. See how the AR size changes:
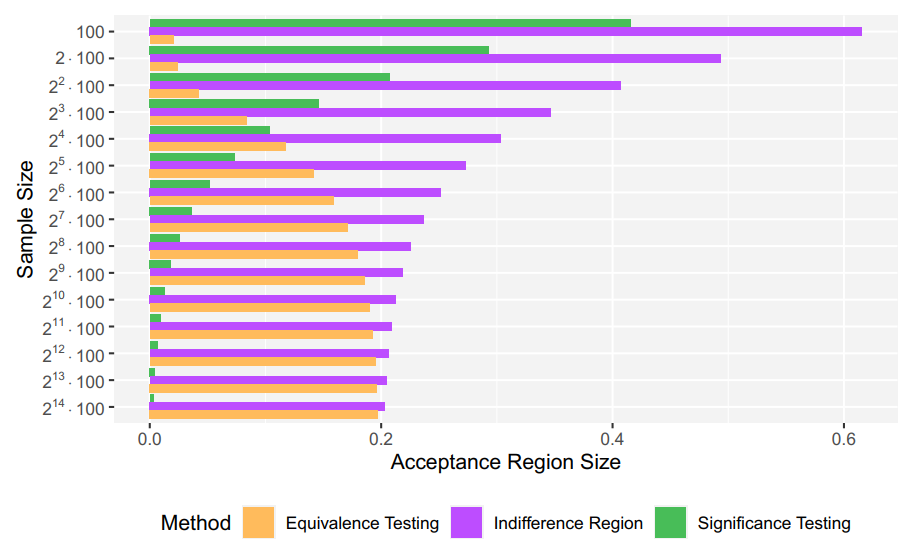
Change of AR size according to testing methodology

(This plot is taken from the background section of my MA thesis).

For your case, I believe that ET wouldn't be very helpful as the sample size isn't that large. Try using indifference region and see how it goes.

$\endgroup$

Your Answer

By clicking “Post Your Answer”, you agree to our terms of service and acknowledge you have read our privacy policy.

Not the answer you're looking for? Browse other questions tagged or ask your own question.