As far as I know if the assumption for Mann Whitney for similar distribution of shape is not met the test results represent the test of the mean rank instead of median. What does this mean for the result??
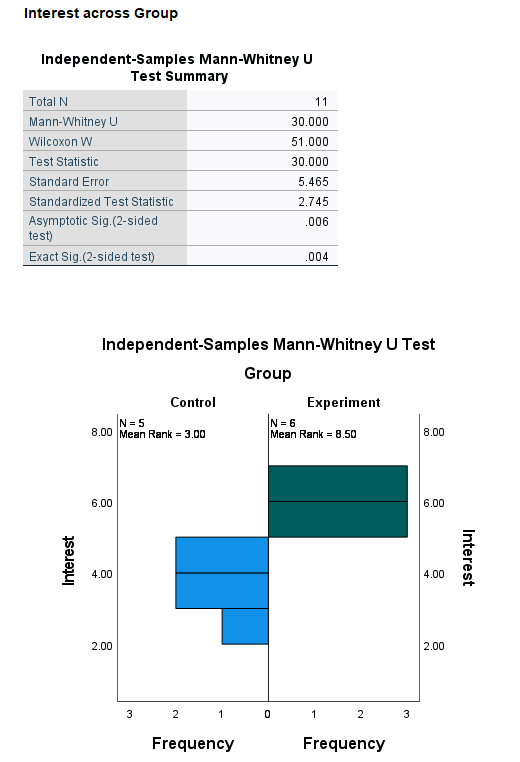
I am analyzing the difference between scores of two independent sample groups (6 in Experiment Group and 5 in Control group) for Intrinsic Motivation Inventory score. I am testing motivation after using a fitness application. Experiment Group using my application and control group using other application. All subjects are university students ( 8 males , 3 Females).

-
$\begingroup$ Do you have two particular samples to compare, or a particular experimental situation in mind? $\endgroup$– BruceETCommented Jan 5, 2022 at 5:36
-
1$\begingroup$ @BruceET hey thank you , I have updated the question. $\endgroup$– LELOUCHCommented Jan 5, 2022 at 6:24
-
$\begingroup$ Good. My sample sizes are larger than the ones you show, so the Wilcoxon rank sum test has better power to detect small differences than for a small sample. But your experimental group clearly dominates you control group, so you should see a significant difference. (Even so, I would not use a Wilcoxon rank sum test unless both samples are at least of size five.) $\endgroup$– BruceETCommented Jan 5, 2022 at 6:30
-
$\begingroup$ Welcome! If you are going to use this site often, I hope you will take the tour of the site to learn how it works and how to ask questions that will get the most useful answers. (Also, you'll get a few 'reputation points' for taking the tour, so you can participate more fully. Right now you can 'Accept' answers, with a few more points you can vote up and down. Etc. // When you ask a question, it is a good idea to look in the margin for 'Related' links that may have answers to similar Q's, or invite you to think about related topics. (It's even possible you'll find an exact answer there.) $\endgroup$– BruceETCommented Jan 5, 2022 at 6:55
-
$\begingroup$ Thank you. I will def take a tour when i have some free time,. $\endgroup$– LELOUCHCommented Jan 5, 2022 at 7:20
1 Answer
If two samples have roughly the same shape, then the Mann-Whitney-Wilcoxon test (a rank sum test) can be considered a test whether the locations (often expressed as medians) differ. Consider fictitious data sampled in R.
set.seed(104)
y1 = rgamma(100, 3, 1/3)
y2 = rgamma(100, 3, 1/3) + 4
median(y1);  median(y2)
[1] 7.684493
[1] 11.85169

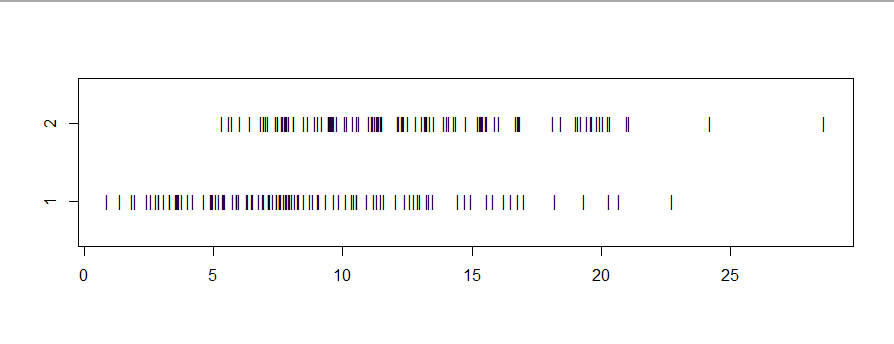
stripchart(list(y1,y2), ylim=c(.5,2.5), pch="|")
Because the P-value of the Wilcoxon rank sum test is near $0.$ we can say that sample medians $7.68$ and $11.95$ are significantly different at the 1% level.
wilcox.test(y1, y2)

        Wilcoxon rank sum test with continuity correction

data:  y1 and y2
W = 2634, p-value = 7.477e-09
alternative hypothesis:
 true location shift is not equal to 0
However, if two samples have distinctly different shapes, rejection of the null hypothesis of the Wilcoxon rank sum test should be interpreted to mean that the population distribution of one sample 'stochastically dominates' the population distribution of the other.
set.seed(2022)
x1 = rgamma(100, 3, 1/3)
x2 = rnorm(100, 12, 3)

summary(x1)
   Min. 1st Qu.  Median    Mean 3rd Qu.    Max.
  0.868   5.643   7.962   8.411  11.274  19.239
summary(x2)
   Min. 1st Qu.  Median    Mean 3rd Qu.    Max.
  5.654   9.625  11.456  11.756  13.877  19.377


stripchart(list(x1,x2), ylim=c(.5,2.5), pch="|")
wilcox.test(x1,x2)

        Wilcoxon rank sum test with continuity correction

data:  x1 and x2
W = 2531, p-value = 1.624e-09
alternative hypothesis:
 true location shift is not equal to 0
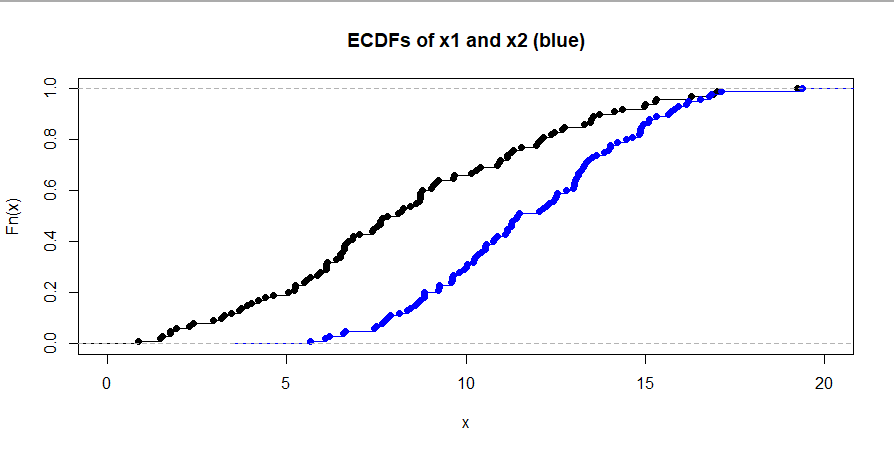
Stochastic domination means that values in the second population tend to be larger than values in the first. Perhaps this is best illustrated by showing the empirical CDFs (ECDFs) of the two samples. The dominating ECDF (blue in the figure below) plots to the right of the other ECDF, and thus below.
hdr  = "ECDFs of x1 and x2 (blue)"
plot(ecdf(x1), xlim=c(0, 20), main=hdr)
lines(ecdf(x2), col="blue")


