3
$\begingroup$

I have a sample of ~3,000 star systems, and I've found the distribution of a particular parameter. I'd like to find the standard deviation of this distribution, and so I've used the standard deviation equation I'm familiar with:

$\sigma = \sqrt{\frac{1}{N - 1}\sum_{n = 0}^{N}{(x_n^2 - \bar{x}^2)}}\tag{1}$

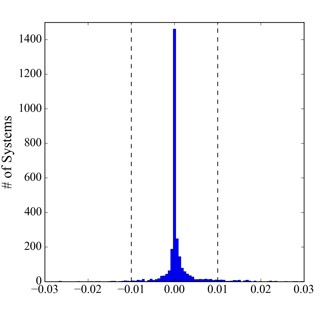
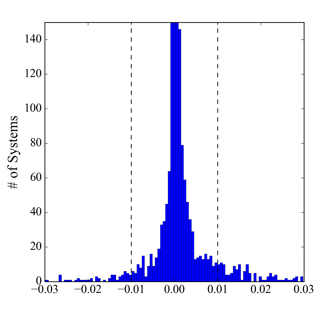
However, the standard deviation this gives is much too large. The two graphs below show the distribution and a zoomed-in view of the distribution:

enter image description hereenter image description here

Equation 1 gives $\sigma = 0.0083$, but the graphs above show that $\sigma \approx 0.001$. The distribution is clearly non-Gaussian. I'm not sure if Equation 1 holds for non-Gaussian distributions, but I'm unsure about how I would go about calculating a standard deviation. I'm also not sure if things like the central limit theorem apply here, because that seems limited to random selections from a population, while this is simply the entire population. What's the correct methodology to find $\sigma$ for this case?

$\endgroup$
6
  • $\begingroup$ You are mentioning a parameter but (1) seems to involve the observations, hence give the sd of the sampling distribution, Normal or non-Normal. $\endgroup$
    – Xi'an
    Commented Aug 9, 2022 at 17:06
  • $\begingroup$ Re "the graphs above show that:" this tells us that what you mean by "$\sigma$" is not the standard deviation; it must be something else. What is it to you? Half width at half peak height? Half the IQR? Something else? $\endgroup$
    – whuber
    Commented Aug 9, 2022 at 17:15
  • $\begingroup$ I think in some sense that what it means to me is that ~68% of my sample lie within this number $\sigma$ of the mean value, which is $\approx 0$. Isn't that what the standard deviation is, though? A measure of how spread out a population is? $\endgroup$
    – mknote
    Commented Aug 9, 2022 at 17:49
  • 1
    $\begingroup$ If that’s what you want, then my answer gives you exactly how to compute such a number. // Yes, standard deviation has a relationship to spread, but you’re seeing that the $68\%$ rule need not apply to every distribution. Making no assumptions except that the standard deviation exists, the best we can do is bound the density using Chebyshev’s inequality. $\endgroup$
    – Dave
    Commented Aug 9, 2022 at 17:54
  • $\begingroup$ If you want to use the middle $68\%$ of the distribution, by all means do so: that's a perfectly valid measure of spread of a distribution. But it's not the standard deviation. It is an accident that these two values will be the same for a perfectly Normal distribution (and for a few other special distributions). BTW, the calculation is dead simple: subtract the 16th quantile from the 84th quantile of your data. $\endgroup$
    – whuber
    Commented Aug 9, 2022 at 18:40

1 Answer 1

0
$\begingroup$

By saying that you bound too much too much of your data, you seem to be saying that you want to bound the middle $68\%$ of the data the way that $(\mu-\sigma, \mu+\sigma)$ does for Gaussian distributions.

To do that, you calculate the empirical quantiles. For the lower endpoint, you want the $0.16$ quantile ($16$th percentile), as $50-(68/2)=16$. For the upper endpoint, you want the $0.84$ quantile, as $50+(68/2)=84$.

If you want a one-number summary, you could say that the middle $68\%$ of the data are contained within $(q_{0.84}-q_{0.16})/2$, where $q_k$ is the $k$th quantile.

(It could be argued that you should take the quantile corresponding to the mean, rather than taking the median, as there are no guarantees that the mean and median are equal. Seeing your graph, I am comfortable assuming them to be equal, however.)

Your calculation of the standard deviation is correct. As you’ve found out, however, the value does not tell you the same information as it would in a Gaussian setting. Unless we make some distribution assumptions, the best we can do it the Chebyshev inequality.

$\endgroup$
4
  • $\begingroup$ Seeing as how the calculation for standard deviation is correct, would using Chebyshev's inequality be appropriate here? $\endgroup$
    – mknote
    Commented Aug 9, 2022 at 17:54
  • $\begingroup$ @mknote What do you want to say using the inequality? $\endgroup$
    – Dave
    Commented Aug 9, 2022 at 17:58
  • $\begingroup$ In some sense, it's not that I want to say anything per se, it's more that I'm trying to explain why the $\sigma$ I calculated seems unrealistically large given the right-hand figure in my post. Chebyshev's inequality implies that my $\sigma$ isn't unrealistically large, as it satisfies the inequality (much less than 25% of the sample lies beyond 2$\sigma$), so it seems to me that the best answer is that it's because the distribution is non-normal, rather than that I made a mistake in calculating $\sigma$. I mainly wanted to verify that that understanding was correct. $\endgroup$
    – mknote
    Commented Aug 9, 2022 at 18:05
  • 1
    $\begingroup$ Yes, that understanding is correct. // There’s a subtle difference, but you’re calculating the sample standard deviation, $s$, and not the population standard deviation, $\sigma$. I also see some other issues with how you discuss population vs sample, but those are topics for a separate question. $\endgroup$
    – Dave
    Commented Aug 9, 2022 at 18:25

Your Answer

By clicking “Post Your Answer”, you agree to our terms of service and acknowledge you have read our privacy policy.

Not the answer you're looking for? Browse other questions tagged or ask your own question.