2
$\begingroup$

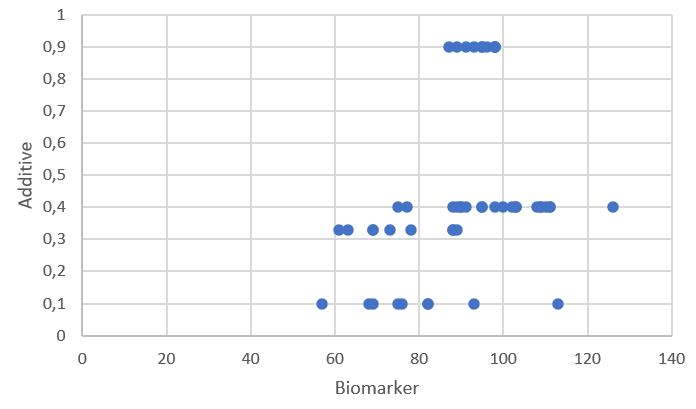
I would like to assess the relationship between one quantitative variable (blood biomarker) and one ordinal variable (food additive) but with non proportional gaps between elements, i.e. 4 categories with the following values: 0.1, 0.33, 0.4, 0.9 (values are increasing but gaps are not proportional between elements). Here is what it looks like when I plot them:

enter image description here

Which statistical method should I use to assess the relationship between both variables? I want to know e.g. if the biomarker increases when the additive increases too or the other way round. Should I treat the additive as a quantitative or qualitative ordinal variable? Looking at the plot ordinal would seem better to me. I thought of Spearman's rank correlation of Kendall's rank correlation. Would these tests be appropriate? Or should I use ANOVA?

$\endgroup$
10
  • $\begingroup$ What do $0.1, 0.33, 0.4, 0.9$ signify? They look too precise to be ordered labels $\endgroup$
    – Henry
    Commented Aug 19, 2022 at 14:17
  • $\begingroup$ @Henry indeed, this was not clear, I edited my post. Acutally these numbers correspond to an additive in food. I want to know if there is a relationship with a biomarker analysed in the blood. $\endgroup$
    – Falco
    Commented Aug 19, 2022 at 14:28
  • $\begingroup$ Again, these labels and the graph give the impression of two metric values. Why do you call the Additive ordinal? Because it is discrete? There seems to be a non.monotoneous relationship. In that case neither Spearman nor Kendall are appropriate. Is one of them a natural predictor of the other? Does Biomarker lead to Additive or Additive lead to Biomarker? $\endgroup$
    – Bernhard
    Commented Aug 19, 2022 at 14:33
  • $\begingroup$ @Bernhard yes the Additive variable is actually discrete, but I only have 4 values ("4 groups") and I am a bit confused with this. Actually I collected data from 4 farms. All animals from the same farm were given the same quantity of additive in their feed. Then a blood biomarker was analysed from each animal. I want to know if there is a relationship between the given additive and the blood biomarker. $\endgroup$
    – Falco
    Commented Aug 19, 2022 at 14:37
  • 1
    $\begingroup$ This might be considered obvious, but here goes. I imagine that food might affect blood but blood does not affect food. If so, the axes are the wrong way round compared with graphical convention. More importantly it seems reasonable to consider mean or median biomarker as a function of additive. As there seems to be only a weak relationship how far does it matter how the variables are classified? But I agree with other discussants that there may be some confusion between discrete and categorical here: the fact that you regard gaps as informative seemingly rules out ordinal as a label. $\endgroup$
    – Nick Cox
    Commented Aug 19, 2022 at 15:04

1 Answer 1

1
$\begingroup$

Assuming from the visuals of it that there does not seem to be some simple rule (linear relationsship, exponential relationship) between the four concentrations and assuming that there are only few discrete points on the Additive scale to find such a relationship, I'd resort to looking at the Additive concentrations as nominal.

In that case, a simple one-way ANOVA with the concentrations (or the farm) as the grouping variable to compare the means and find proof of differences of means seems in order.

Alternatively, if we try to find a smooth function, a GAM could do that.

Your data looks a bit like this:

expl <- data.frame(additive = rep(c(.9, .4, .33, .1), c(8, 17, 7, 8)),
                  biomarker = c(85:92,
                                75, 77, 89:93, 95, 98, 100, 103, 104, 108:112,
                                60, 62, 64, 72, 78, 89, 90,
                                57, 68, 69, 75, 76, 83, 94, 115))

ggplot(expl, aes(x = additive, y = biomarker)) +
  geom_point(aes(x = additive, y = biomarker), size = 2, color = "blue") +
  scale_x_continuous(breaks = c(.9, .4, .33, .1)) +
  geom_smooth(method = "lm") +
  theme_minimal()
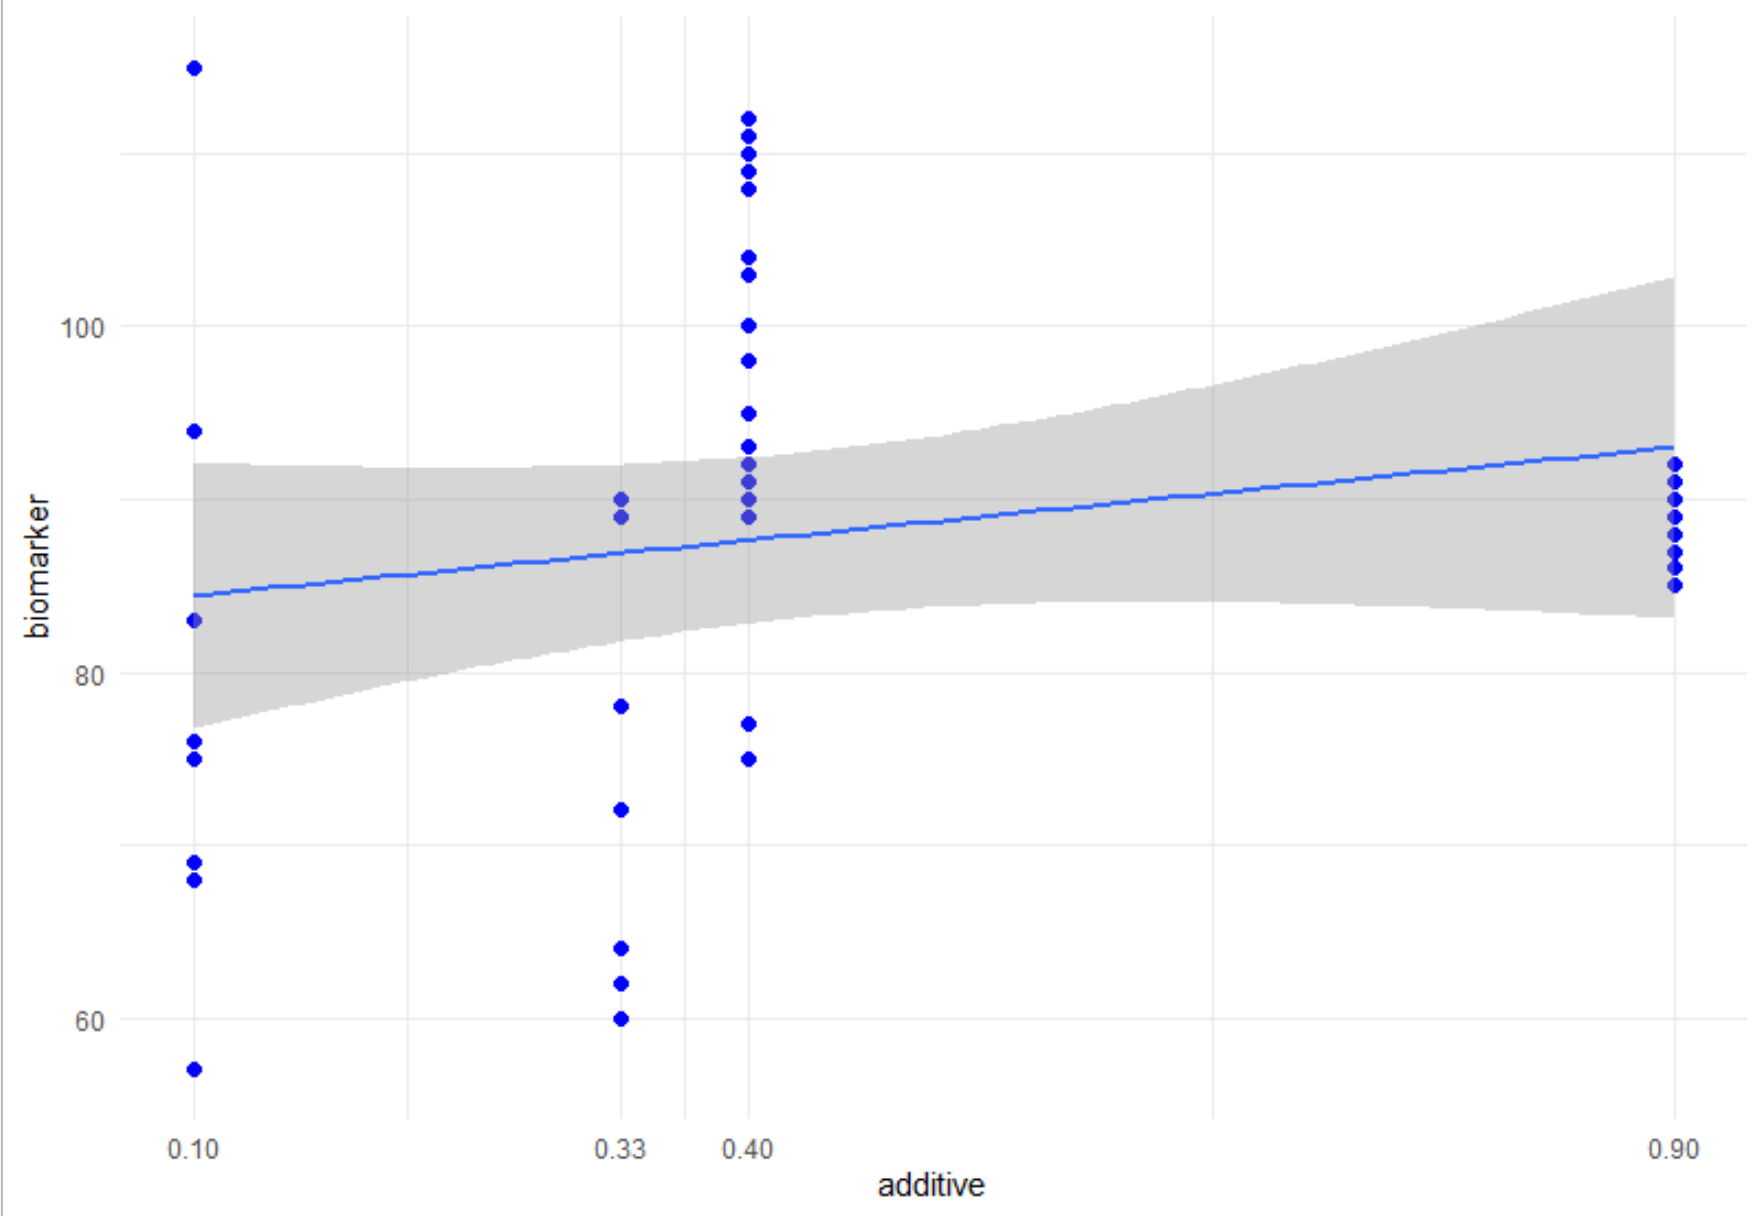
scatterplot and linear regression line

The straight line of the linear regression is obviously a poor fit. A Generalized Additive Model (GAM) could be used:

> gam(biomarker ~ s(additive, k = 3), data = expl)   |> summary()

Family: gaussian 
Link function: identity 

Formula:
biomarker ~ s(additive, k = 3)

Parametric coefficients:
            Estimate Std. Error t value Pr(>|t|)    
(Intercept)   87.925      2.271   38.72   <2e-16 ***
---
Signif. codes:  0 ‘***’ 0.001 ‘**’ 0.01 ‘*’ 0.05 ‘.’ 0.1 ‘ ’ 1

Approximate significance of smooth terms:
              edf Ref.df     F p-value
s(additive) 1.763  1.944 1.974   0.117

R-sq.(adj) =  0.0875   Deviance explained = 12.9%
GCV = 221.55  Scale est. = 206.24    n = 40

However, coming from observations at only 4 discrete points, would you believe that the following cubic spline represents biological truth?
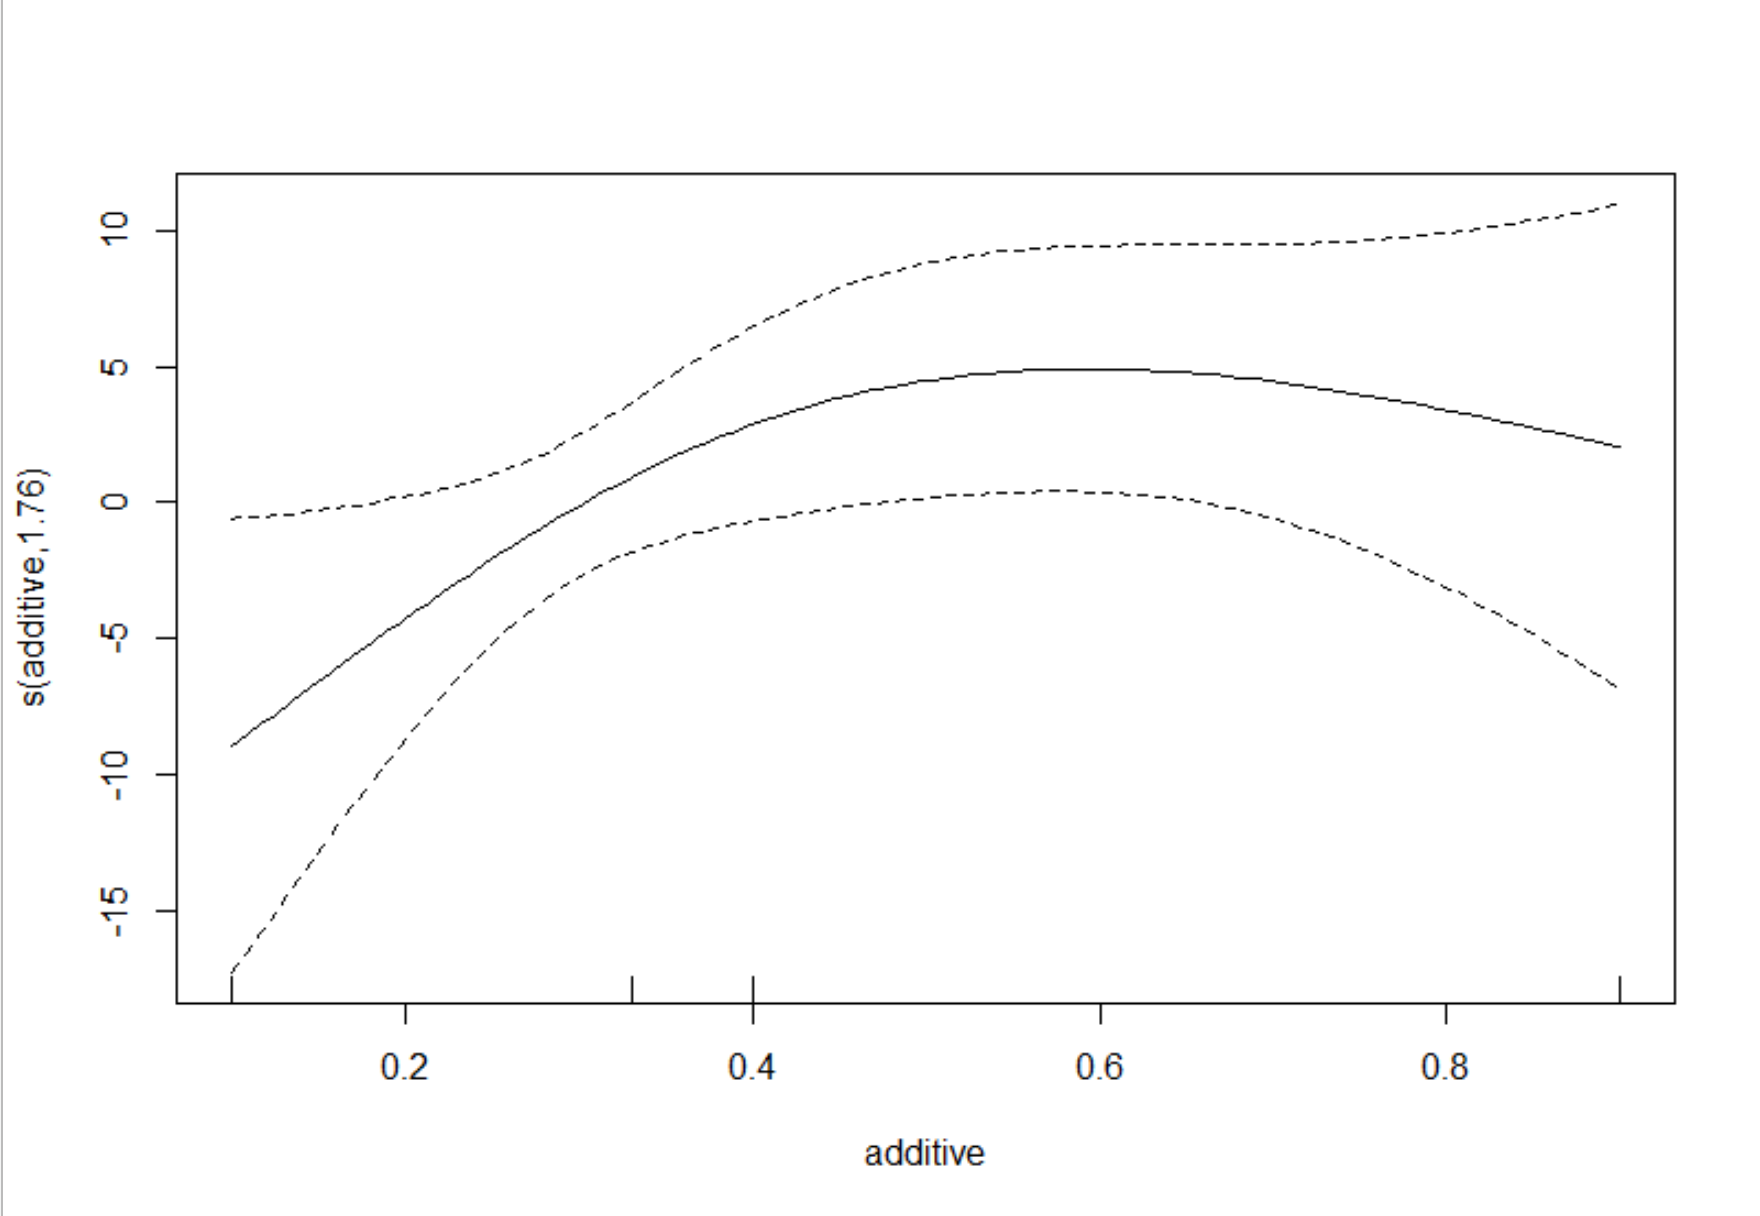
cubic spline computed by mgcv with k = 3

Notably, the elaborated GAM does not yield a significant result, the above mentioned ANOVA does:

> oneway.test(biomarker ~ as.factor(additive), data = expl)

    One-way analysis of means (not assuming equal variances)

data:  biomarker and as.factor(additive)
F = 6.9074, num df = 3.000, denom df = 14.287, p-value = 0.004209

You will have to decide what method delivers the answers that you need and which answer makes biological sense. Given, that the four groups are not only differing in Additive but also in farm specific details, the ANOVA appears more sensible to me.

$\endgroup$
4
  • $\begingroup$ Thank you! Is the difference in standard deviation (variance) between the groups (i.e., 0.9 group has a smaller SD) a problem for ANOVA? $\endgroup$
    – Falco
    Commented Aug 19, 2022 at 15:21
  • 1
    $\begingroup$ There appear to be specific methods for that, see stackoverflow.com/questions/11816948/… also statisticsbyjim.com/anova/… $\endgroup$
    – Bernhard
    Commented Aug 19, 2022 at 15:26
  • 2
    $\begingroup$ Additional ressource: B. L. Welch (1951). On the comparison of several mean values: an alternative approach. Biometrika, 38, 330–336. doi: 10.2307/2332579. I have edited code in my answer accordingly $\endgroup$
    – Bernhard
    Commented Aug 19, 2022 at 15:33
  • $\begingroup$ Thank you very much for your help! I think Welch's ANOVA might be the appropriate test for my data. $\endgroup$
    – Falco
    Commented Aug 19, 2022 at 15:41

Your Answer

By clicking “Post Your Answer”, you agree to our terms of service and acknowledge you have read our privacy policy.

Not the answer you're looking for? Browse other questions tagged or ask your own question.