Moved from Stack Overflow
Could someone help me to find adequate regression model for my data?
I tried to find one by changing the model and initial approximation (ln 15-16) in this simple Python program:
# -*- coding: utf-8 -*-

import matplotlib.pyplot as plt
import numpy as np
import scipy.linalg as la

from numpy import random

from scipy.optimize import minimize


def main():
    a = np.loadtxt('group_all_tweets.dat', dtype=np.float32, delimiter='\t')

    sin_model = lambda p, x: (p[0] + p[1] * np.exp(np.sin((np.pi / p[2]) * x + p[3]))**3)
    x0 = np.array([1.58e+04, -1.72e+03, 24.0, 7.59])

    res = minimize(lambda p: la.norm(sin_model(p, a[:, 0]) - a[:, 1]),
                   x0=x0,
                   method='Powell')
    print res

    sin_params = res['x']

    plt.plot(a[:, 0], a[:, 1])
    plt.plot(a[:, 0], sin_model(sin_params, a[:, 0]))

    plt.figure()

    rss = a[:, 1] - sin_model(sin_params, a[:, 0])

    pol_model = lambda p, x: sum([p[i] * x**i for i in xrange(4)])
    x0 = np.array([0.0 for i in xrange(4)])
    res = minimize(lambda p: la.norm(pol_model(p, a[:, 0]) - rss),
                   x0=x0,
                   method='Powell')
    print res

    pol_params = res['x']

    rss = a[:, 1] - sin_model(sin_params, a[:, 0]) - pol_model(pol_params, a[:, 0])
    plt.plot(a[:, 0], rss)
    plt.figure()

    plt.plot(a[:, 0], a[:, 1])
    plt.plot(a[:, 0], sin_model(sin_params, a[:, 0]) + pol_model(pol_params, a[:, 0]))

    plt.show()


if __name__ == '__main__':
    main()
Here, firstly I try to find a periodic pattern ((p[0] + p[1] * np.exp(np.sin((np.pi / p[2]) * x + p[3]))**3)) while p[i] are varying parameters, then approximate the remains of the first regression with second, polynomial regression.
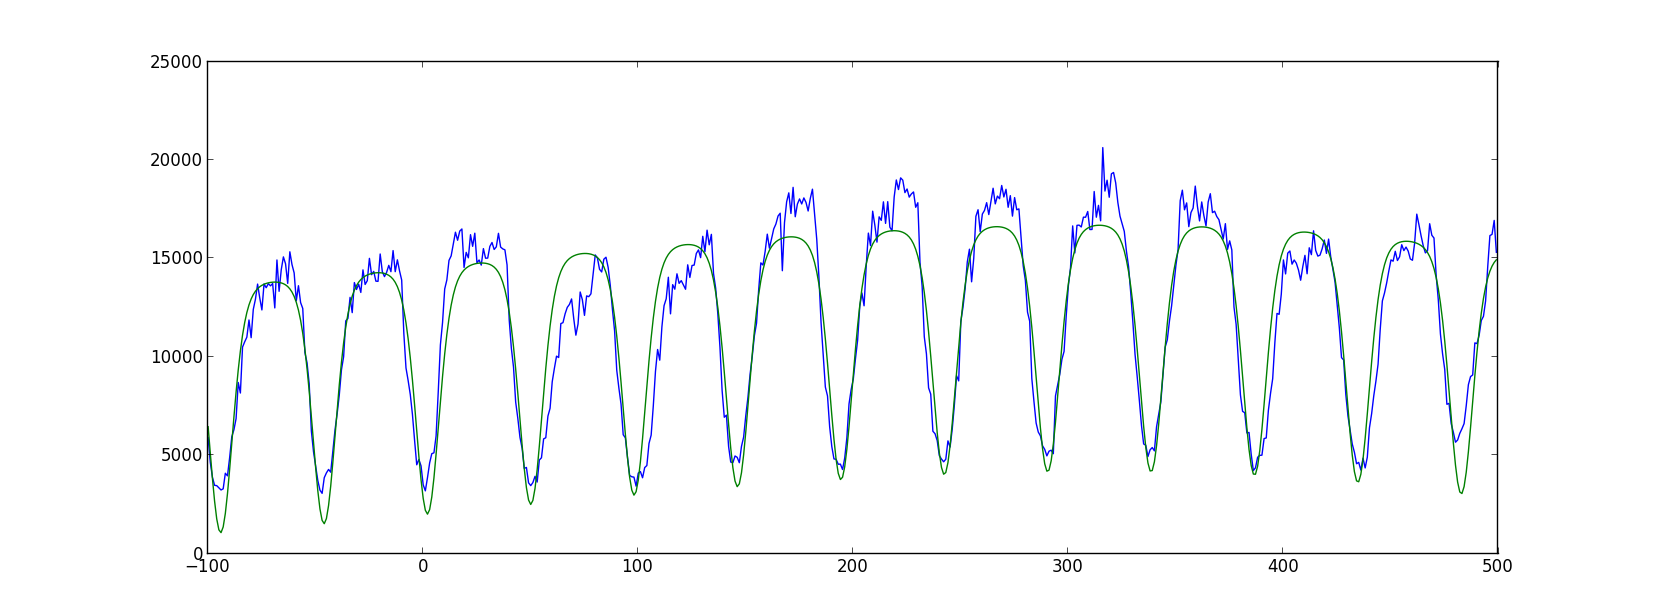
The best result that I managed to get with the method described is shown in in the graph below:

I'm pleased with how the fit is approaching the bottom part of the graph, but the top parts I just do not like.
Has anyone here an experience of finding of regression models? I would be grateful for any help. Thank you.
The datafile is here. I need to find a dependence of the second column from the first.
I think I want to build a model which contains a periodical component, with "top-trend" and "bottom-trend" components, last two are independent.

