22
$\begingroup$

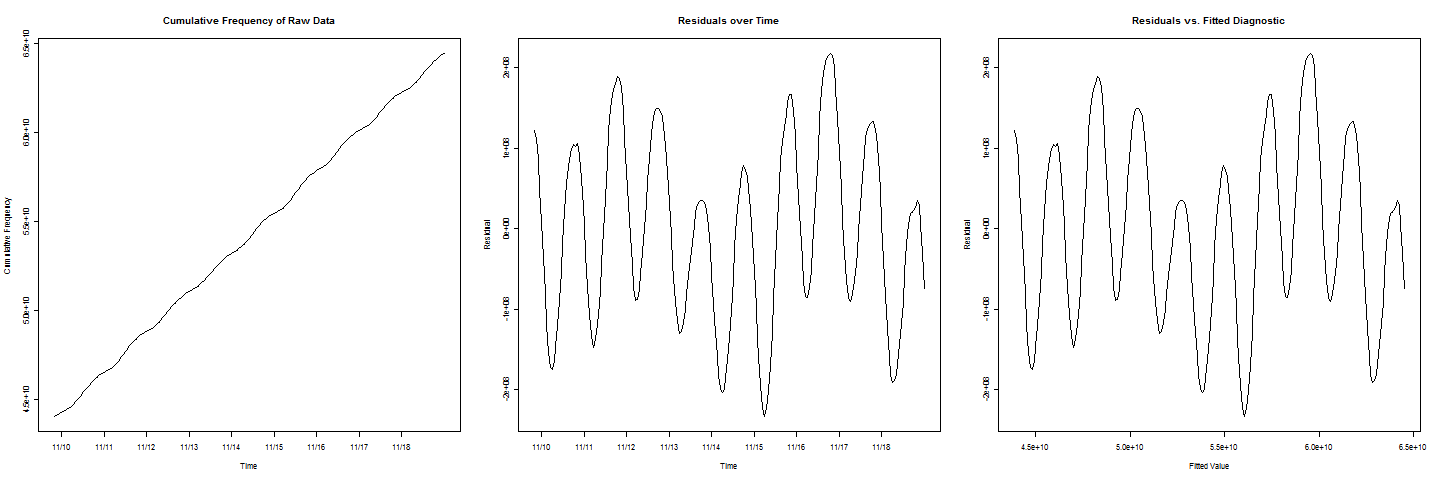
I have some cumulative frequency data. A line $y=ax+b$ looks like it fits the data extremely well, but there is cyclic/periodic wiggle in the line. I would like to estimate when the cumulative frequency will reach a certain value $c$. When I plot the residuals vs. fitted values, I get a beautiful sinusoidal behavior.

Now, to add another complication, note that in the residuals plots
alt text

there are two cycles that have lower values than the others, which represents a weekend effect that also must be taken into account.

So, where do I go from here? How can I combine some cosine, sine, or cyclic term into a regression model to approx. estimate when the cumulative frequency will equal $c$?

$\endgroup$

4 Answers 4

9
$\begingroup$

You could try the wonderful stl() method -- it decomposes (using iterated loess() fitting) into trend and seasonal and remainder. This may just pick up your oscillations here.

$\endgroup$
8
$\begingroup$

If you know the frequency of the oscillation, you can include two additional predictors, sin(2π w t) and cos(2π w t) -- set w to get the desired wavelength -- and this will model the oscillation. You need both terms to fit the amplitude and the phase angle. If there is more than one frequency, you will need a sine and cosine term for each frequency.

If you don't know what the frequencies are, the standard way to isolate multiple frequencies is to detrend the data (get the residuals from the linear fit, as you have done) and run a discrete Fourier transform against the residuals. A quick and dirty way to do this is in MS-Excel, which has a Fourier Analysis tool in the Data Analysis Add-In. Run the analysis against the residuals, take the absolute value of the transforms, and bar graph the result. The peaks will be your major frequency components that you want to model.

When you add these cyclic predictors, pay close attention to their p-values in your regression, and don't overfit. Use only those frequencies that are statistically significant. Unfortunately, this may make fitting the low frequencies a little difficult.

$\endgroup$
1
  • 3
    $\begingroup$ When you estimate the frequencies from the data (as with Fourier analysis) and then include them as sin/cos terms in the regression, their p-values will be meaningless. $\endgroup$
    – whuber
    Commented Mar 1, 2011 at 17:54
4
$\begingroup$

Let's begin by observing that ordinary least squares fitting for these data is likely inappropriate. If the individual data being accumulated are assumed, as usual, to have random error components, then the error in the cumulative data (not the cumulative frequencies--that's something different than what you have) is the cumulative sum of all the error terms. This makes the cumulative data heteroscedastic (they become more and more variable over time) and strongly positively correlated. Because these data are so regularly behaved, and there's so much of them, there's little problem with the fit you will get, but your estimates of errors, your predictions (which is what the question is all about), and especially your standard errors of prediction can be way off.

A standard procedure for analyzing such data starts with the original values. Take the day-to-day differences to remove the higher-frequency sinusoidal component. Take the weekly differences of those to remove a possible week-to-week cycle. Analyze what's left. ARIMA modeling is a powerful flexible approach, but start simply: graph those differenced data to see what's going on, then move on from there. Note, too, that with less than two weeks of data your estimates of the weekly cycle will be poor and this uncertainty will dominate the uncertainty in the predictions.

$\endgroup$
2
$\begingroup$

Clearly the dominant oscillation has period one day. Looks like there are also lower-frequency components relating to the day of the week, so add a component with frequency one week (i.e. one-seventh of a day) and its first few harmonics. That gives a model of the form:

$$\mbox{E}(y) = c + a_0 \cos(2\pi t) + b_0 \sin(2\pi t) + a_1 \cos(2 \pi t/7) + b_1 \sin(2 \pi t/7) + a_2 \cos(4 \pi t/7) + b_2 \sin(4 \pi t/7) + \ldots $$

– assuming $t$ is measured in days. Here $y$ is the raw data, not its cumulative sum.

$\endgroup$

Your Answer

By clicking “Post Your Answer”, you agree to our terms of service and acknowledge you have read our privacy policy.

Not the answer you're looking for? Browse other questions tagged or ask your own question.