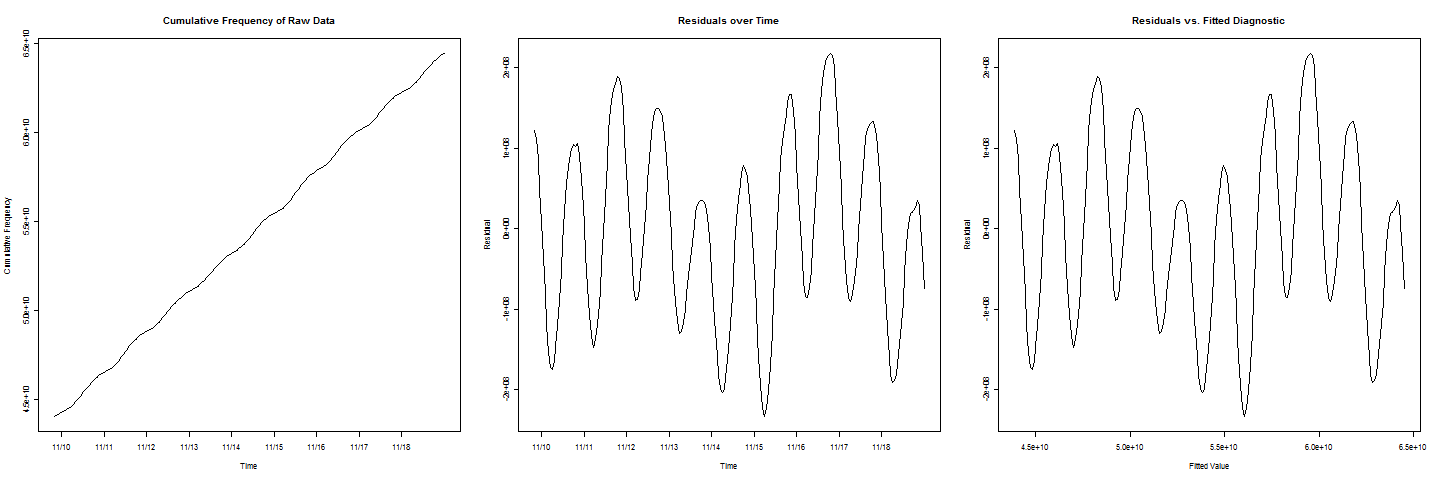
I have some cumulative frequency data. A line $y=ax+b$ looks like it fits the data extremely well, but there is cyclic/periodic wiggle in the line. I would like to estimate when the cumulative frequency will reach a certain value $c$. When I plot the residuals vs. fitted values, I get a beautiful sinusoidal behavior.
Now, to add another complication, note that in the residuals plots

there are two cycles that have lower values than the others, which represents a weekend effect that also must be taken into account.
So, where do I go from here? How can I combine some cosine, sine, or cyclic term into a regression model to approx. estimate when the cumulative frequency will equal $c$?
