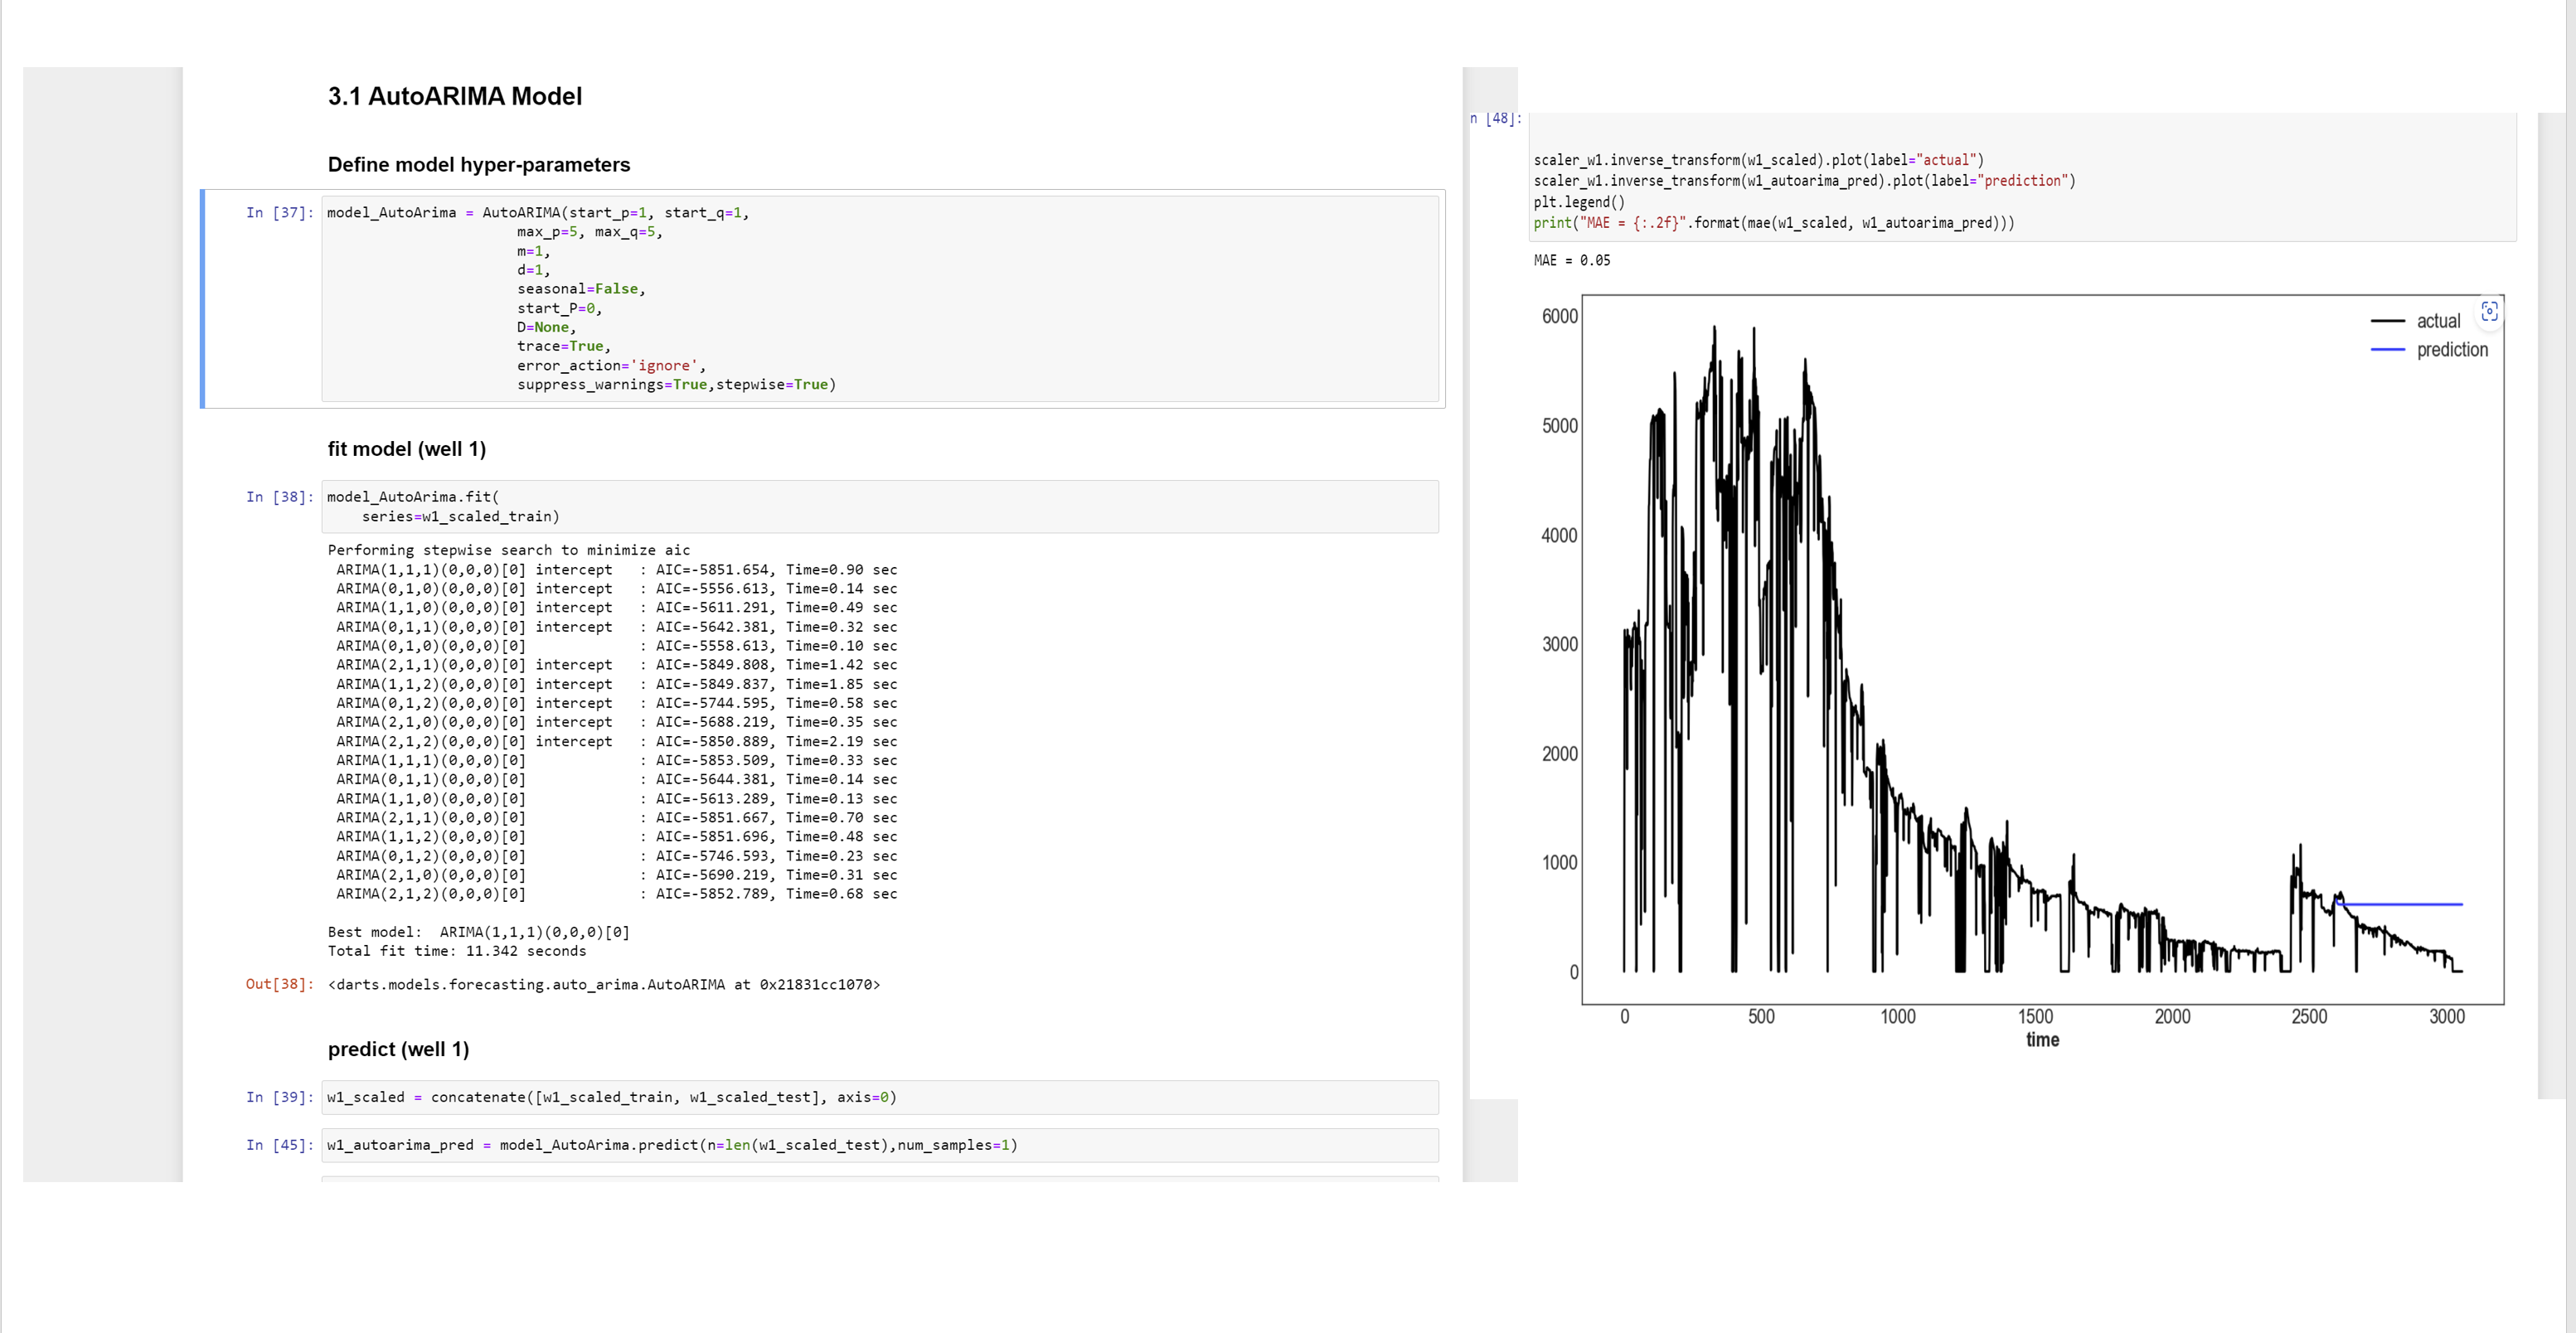
I'm doing time series forecasting using AutoARIMA model from the darts library. However, the prediction output is a straight line. I don't know how I should fix this, any suggestion & help please!
-
1$\begingroup$ What happened around 2500? $\endgroup$– forecasterCommented Nov 3, 2022 at 11:02
-
$\begingroup$ Please clarify your specific problem or provide additional details to highlight exactly what you need. As it's currently written, it's hard to tell exactly what you're asking. $\endgroup$– utobiCommented Nov 3, 2022 at 11:54
-
$\begingroup$ Very similar questions have been asked a number of times on this site. Check them out: stats.stackexchange.com/search?q=%5Barima%5D+straight+line. (There are probably more.) How is your question different from these? $\endgroup$– Richard HardyCommented Nov 3, 2022 at 12:19
1 Answer
Please notice that your forecast is not "completely flat", you converge to a particular value as the selected ARIMA model is (1,1,1)(0,0,0) so in the end our estimates get attenuated around their expected mean.
Just some background: An AR(1) is suggests $y_t = \mu +\phi_1 y_{t-1} + e_t$, MA(1) suggests that $y_t = e_t +\theta_1 y_{t-1}$ and ARIMA(0,1,0) suggests: $y_t = \mu + y_{t-1}$. Here $e_t$ are our white noise (error) at time $t$ and $\theta_i$ and $\phi_i$ reflect how much we weigh them, they are simple scalars.
With that out of way our ARIMA(1,1,1) will therefore be: $y_t - y_{t-1} = \mu + \phi_1(y_t - y_{t-1})+ e_t + \theta_1 e_{t-1}$. (Sometimes this is equivalently written out as: $(1-\phi_1 B)(1-B)y_t = \mu + (1 + \theta_1 B) e_t$ where B is the backward shift operator describing our differencing.)
The second tuple (0,0,0) suggests no seasonal components.
Now let's notice what happens as we move forward in forecasting time. $\mu$ is stable so that's "flat", the expectation of $E\{e_t\} = 0$ as it is white noise so that will slowly converge to zero, so that will slowly be flat too, so the only thing left to "drive" our forecasts is $y_{t-1}$. While the post does not output the ARIMA coefficients, assuming $\phi_1$ is not much larger than $\theta_1$, the contribution of it will slowly also be attenuated in the long run as ($y_t - y_{t-1}$) gets smaller due too the dumping effect all other factors have. To that extent, as the estimated $| \phi\ |$ is most likely below $1$, that also suggests convergence to $0$ (i.e. flat). Finally do note that the forecast horizon used, is "very long", the plots shows a situation where we are forecasting hunderds of steps into the future. As similar exposition for a ARIMA(1,0,0) can be found here: ARIMA converges to mean.
I would suggest the following:
- Limit your ARIMA estimates' forecasting horizon substantially. "In the long run we are all dead", and so are our forecasts.
- If we need very long term forecasts we should consider using something like a linear model with an ARMA error structure. We need "stronger" assumptions about the evolution of $\mu$ across time.
- Consider the use of external variables. (Sometimes called exogenous) They allow us to explain events that do not necessarily related to the stochastic nature of our data. For example as @forecaster mentioned, something probably happened at around time 2500 tha had little to do with the overall stochastic volatility and mean trend as we model it with the ARIMA.
- Consider defining a seasonal trend if our data have a periodic pattern (e.g. weekly or daily), while "not much" it helps making the long term forecasts a bit more realistic (assuming that the pattern still holds).

