12
$\begingroup$

I was looking through the answers to this question, and all of them seem to have some form of symmetry between the variables.

I'll walk through the examples in that question so you can see what I mean.

Coin Game Example $Y = \pm X$ and $X = |Y|$ (symmetrical functions)

The $x^2$ and $x$ Example Both the uniform distribution and squaring the samples of the uniform distribution are symmetric about the y axis.

Circle Example Circles are symmetrical across both X and Y axes. (Can include many other axes as well, but I'm not 100% that if you chose different axes that you would get no correlation, so I'm just going to say X and Y.)

Car Velocity Example Similar to $x$ and $x^2$ case, $K$ is essentially $V^2$, and $V$ is essentially $\pm \sqrt{K}$. Again, both functions are symmetric.

So, does 0 correlation and dependence imply a symmetry in the joint variable space? Can anyone describe the symmetry mathematically or provide a mathematical proof that there is a symmetry in the joint space?

$\endgroup$
3
  • 2
    $\begingroup$ This is a nice question that I hope gets more detailed answers than the one I posted, though I do believe it exhibits a suitable counterexample. $\endgroup$
    – Dave
    Commented Nov 15, 2022 at 1:56
  • $\begingroup$ Start with any two variables. Run a principal component analysis. Then the transformed coordinates will be uncorrelated. Not all dependence disappears. $\endgroup$
    – shadow
    Commented Nov 16, 2022 at 7:56
  • 3
    $\begingroup$ The reason you see symmetry is that makes it easy to construct examples. It's not necessary. $\endgroup$
    – Glen_b
    Commented Nov 17, 2022 at 3:52

4 Answers 4

10
$\begingroup$

NO

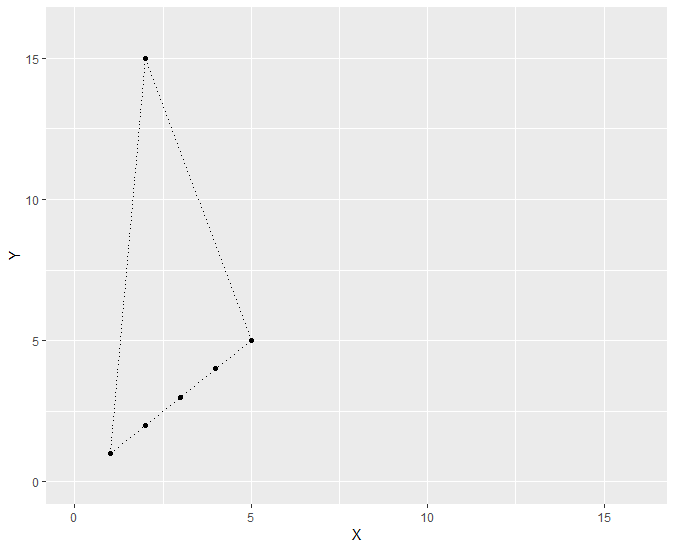
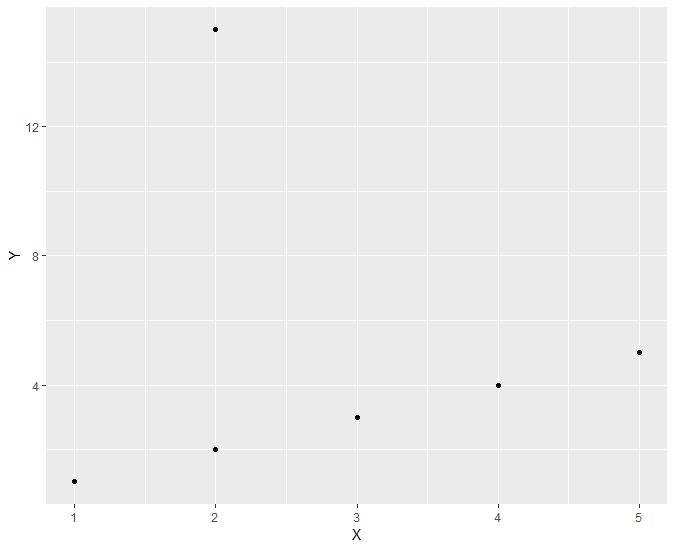
Consider the following bivariate distribution, with uniform probability across the six points.

$$ \{ (1,1),(2,2),(3,3),(4,4),(5,5),(2,15) \} $$

The correlation is zero. However, $P(Y=5)=\frac{1}{6}$ while $P(Y=5\mid X=5)=1$, so the variables are dependent. At the same time, I see no obvious symmetry in the bivariate distribution when I graph it.

enter image description here

enter image description here

Proof that the correlation is zero

Correlation is zero if the covariance between the variables is zero.

$$\operatorname{Cov}(X, Y) = \mathbb E[XY] - \mathbb E[X]\mathbb E[Y]$$ $$\mathbb E[XY] = \dfrac{1}{6}\left((1\times1) + (2\times2) + (3\times3)+(4\times4) + (5\times5)+(15\times 2)\right) = \dfrac{85}{6}$$ $$\mathbb E[X] = \dfrac{1}{6}(1+ 2+ 3+ 4+ 5+ 2) = \dfrac{17}{6}$$ $$\mathbb E[Y] = \dfrac{1}{6}(1 + 2 + 3 + 4 + 5 + 15) = 5$$ $$\implies$$ $$\operatorname{Cov}(X, Y) = \dfrac{85}{6} - \left(\dfrac{17}{6} \times 5\right) = 0$$

Thus, the variables are uncorrelated.

# Code for the plot with the dotted lines

library(ggplot2)
set.seed(2022)
x <- c(1, 2, 3, 4, 5)
y <- c(1, 2, 3, 4, 5)
x <- c(x, 2)
y <- c(y, 15)
cor(x, y)
plot(x, y)
sqrt((1 - 2)^2 + (1-15)^2)
sqrt((5 - 2)^2 + (5-15)^2)
d <- data.frame(X = x, Y = y)
e <- data.frame(x = c(1, 2, 5, 1), y = c(1, 15, 5, 1))
f <- data.frame(x = c(1, 5), y = c(1, 5))
p <- ggplot(d, aes(x = X, y = Y)) + 
  geom_point() + 
  scale_x_continuous(limits = c(0, 16)) +
  scale_y_continuous(limits = c(0, 16))
p <- p + geom_line(data = e, aes(x = x, y = y),linetype = "dotted") 
p <- p + geom_line(data = f, aes(x = x, y = y),linetype = "dotted")
# p <- p + geom_line(data = g, aes(x = x, y = y),linetype = "dotted")
p# + theme_bw()
$\endgroup$
5
  • $\begingroup$ Would you be willing to go through the covariance formula for your points just to prove that they're uncorrelated? $\endgroup$
    – Pro Q
    Commented Nov 15, 2022 at 2:07
  • $\begingroup$ I plugged it into R but can post the full math of it, sure. $\endgroup$
    – Dave
    Commented Nov 15, 2022 at 2:08
  • $\begingroup$ Actually, I was able to do it out and it checks out! I can edit your answer if you don't want to $\endgroup$
    – Pro Q
    Commented Nov 15, 2022 at 2:12
  • 2
    $\begingroup$ @ProQ Please edit! I’m on mobile and am having as much fun as you might expect I am by typing that in $\LaTeX$. $\endgroup$
    – Dave
    Commented Nov 15, 2022 at 2:16
  • $\begingroup$ Edit made, just needs to be approved! $\endgroup$
    – Pro Q
    Commented Nov 15, 2022 at 2:19
15
+100
$\begingroup$

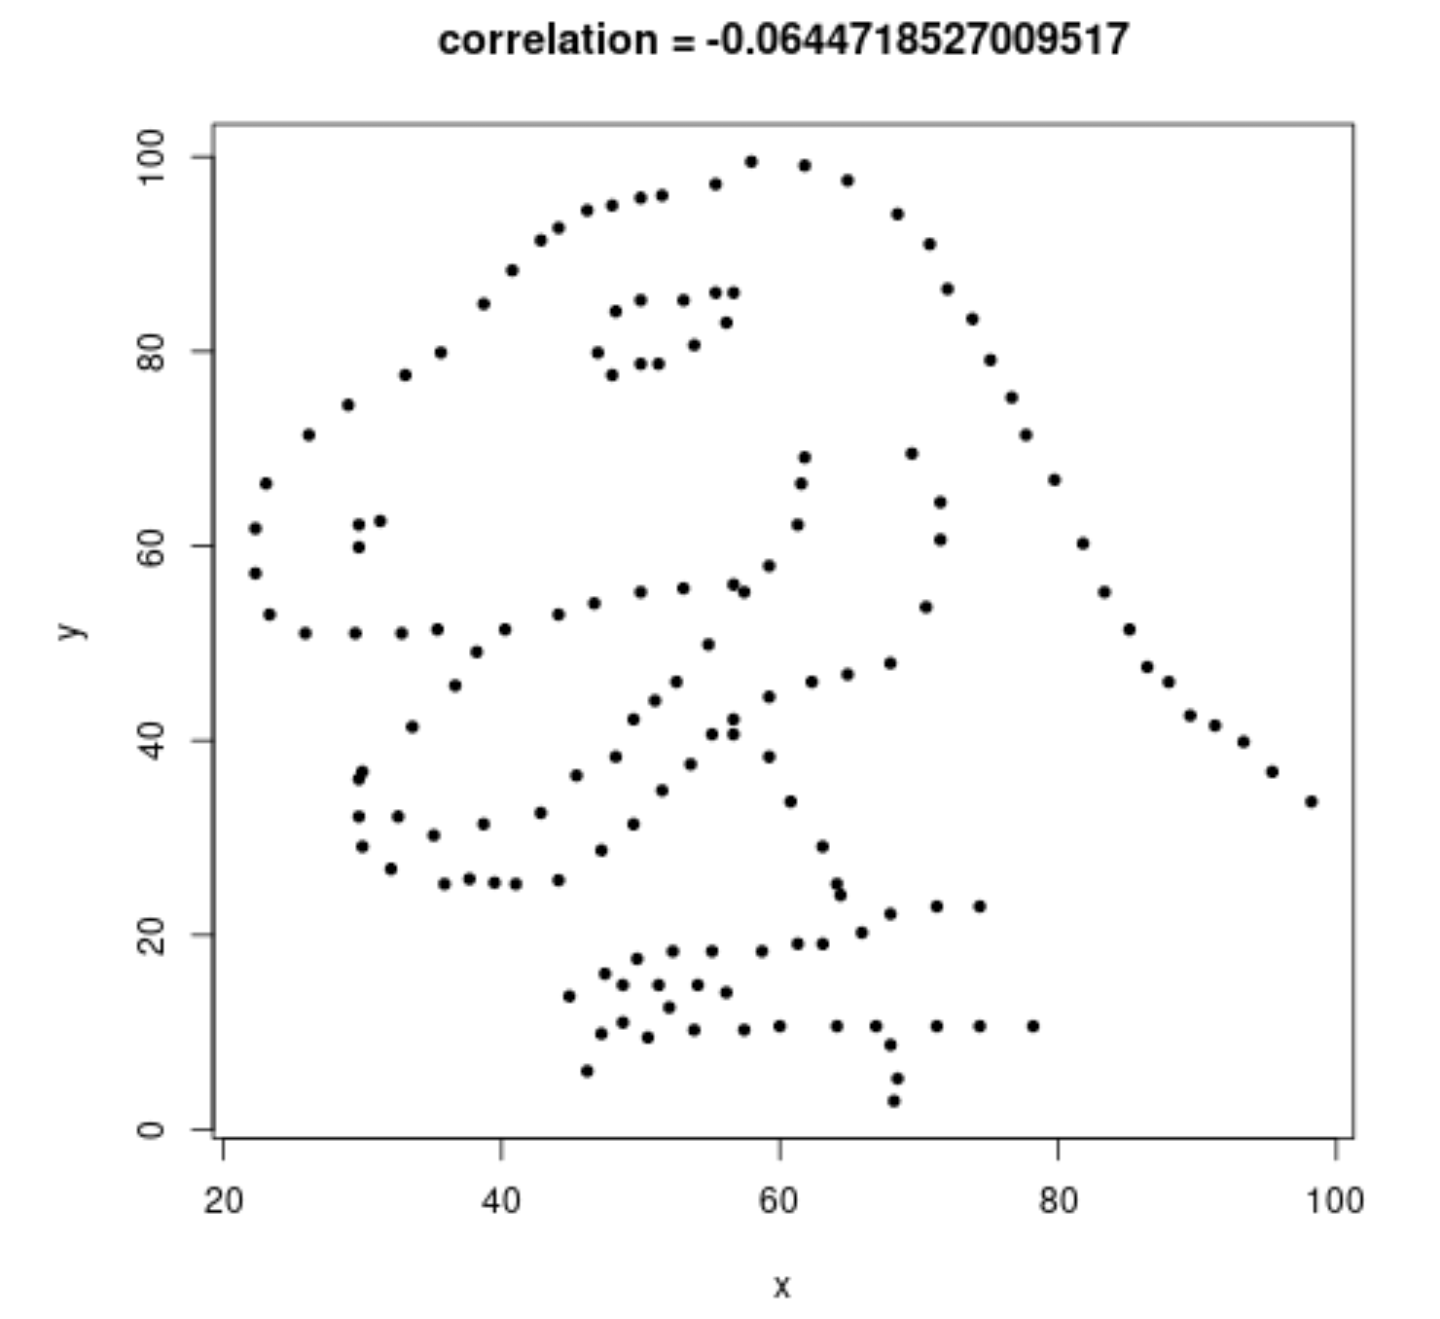
This example from the dinosauRus package shows that you do not need symmetry for zero correlation.

dino

library(datasauRus)
selection = which(datasaurus_dozen$dataset == 'dino')
x = datasaurus_dozen[selection,'x']
y = datasaurus_dozen[selection,'y']
plot(x,y,pch=20)
title(paste0("correlation = ", cor(x,y)))

If you rotate this dataset then you can get the correlation equal to zero

z = cbind(x,y)
newz = z %*% expm::sqrtm(solve(cov(z)))
plot(newz, pch = 20)
title(paste0("correlation = ", cor(newz[,1],newz[,2])))
$\endgroup$
4
  • 1
    $\begingroup$ This speaks for itself. +1. $\endgroup$ Commented Nov 15, 2022 at 13:31
  • 5
    $\begingroup$ +1 If you tack on a point around $(0,-30)$, you can drive the correlation to exactly zero. (I didn’t get the exact coordinates, since I was just playing with the code, but it’s just a mess of algebra to calculate the exact value.) $\endgroup$
    – Dave
    Commented Nov 15, 2022 at 13:39
  • 1
    $\begingroup$ @Dave the rotation can be found by inverting the covariance matrix. I have added an example code. $\endgroup$ Commented Nov 15, 2022 at 14:50
  • 3
    $\begingroup$ Post a dinosaur, get Dave’s points $\endgroup$
    – Dave
    Commented Nov 24, 2022 at 3:01
6
$\begingroup$

Yet another discrete counterexample. Let the joint pmf of $(X, Y)$ be given as follows:

\begin{align} & P(X = -2, Y = 0) = 1/6, P(X = 0, Y = 0) = 0, P(X = 1, Y = 0) = 1/3, \\ & P(X = -2, Y = 1) = 0, P(X = 0, Y = 1) = 1/2, P(X = 1, Y = 1) = 0. \end{align}

As $P(X = 1, Y = 1) = 0 \neq P(X = 1)P(Y = 1) = 1/3 \times 1/2 = 1/6$, $X$ and $Y$ are not independent.

As $P(XY = 0) = 1$ and $E(X) = 0$, $\operatorname{Cov}(X, Y) = E(XY) - E(X)E(Y) = 0 - 0 = 0$, i.e., $X$ and $Y$ are uncorrelated.

Clearly, there are no symmetry in either $x$-direction or $y$-direction. The idea of this construction is to get a "non-symmetrical" random vector such that $P(XY = 0) = 1$, which is relatively easy (by setting probabilities of pairs with non-zero product to be $0$) to achieve under the discrete case.

$\endgroup$
1
$\begingroup$

No, symmetric examples are simply easier to generate and easier to verify (if a graph is horizontally symmetric, then it's obvious that the correlation is zero, without having to do any math). There are plenty of non-symmetric examples. The residuals from a linear regression have zero correlation, so you can take any set data at all, subtract off the line of best fit, and get a zero-correlation set. Moreover, correlation is a single degree of freedom, so it's easy to make it zero. Given any set, there are points that, if added to the set, will result in zero correlation. And there is always some angle such that if the scatterplot is rotated by that much, the result will have zero correlation.

$\endgroup$
2
  • 1
    $\begingroup$ What do you mean by "residuals have zero correlation"? If you view residuals as a vector, then what the other vector it is supposed correlated with (to get "zero correlation")? If you mean the correlation matrix of the residual vector itself, then it is a matrix, instead of a single value. $\endgroup$
    – Zhanxiong
    Commented Nov 18, 2022 at 3:54
  • $\begingroup$ I guess you might mean the vector $X = (1, 1, \ldots, 1)'$ is uncorrelated with $Y = (\hat{e}_1, \ldots, \hat{e}_n)$. However, this is not a very good example because $X$ does not have any randomness. $\endgroup$
    – Zhanxiong
    Commented Nov 18, 2022 at 4:06

Your Answer

By clicking “Post Your Answer”, you agree to our terms of service and acknowledge you have read our privacy policy.

Not the answer you're looking for? Browse other questions tagged or ask your own question.