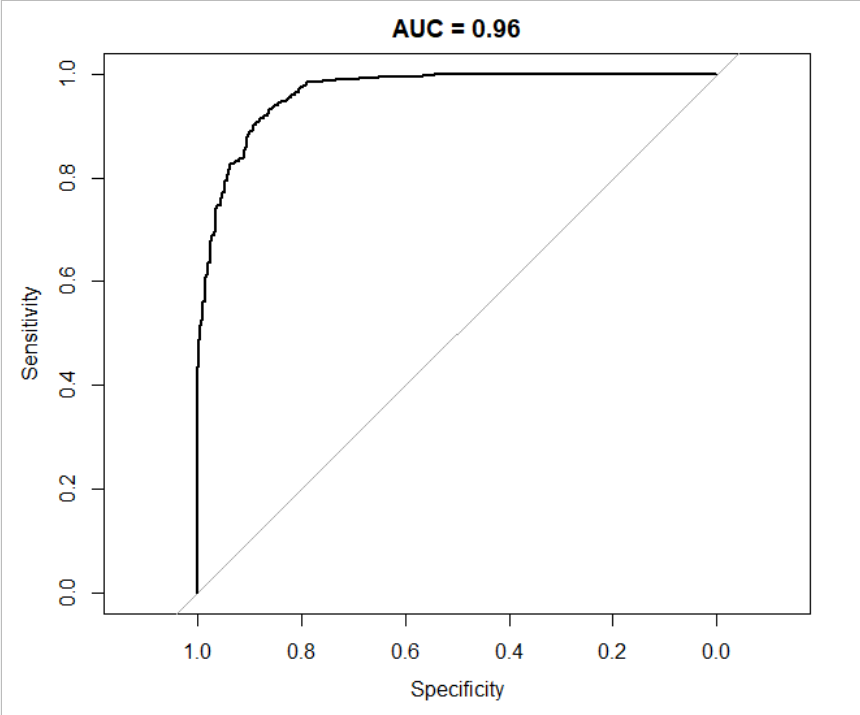
I do not have strong background in statistics but I believe I know the basics to understand what a ROC curve means.
I have a table, first column with probabilities (from 0 to 1) from a predictive test and second with true outcomes with 1 and 0 (1 when the prediction was correct and 0 when failed). I consider the predicted test fails when the sample is pathogenic and shows <0.5. If prediction is >0.5 and sample is pathogenic the test is correct. With this criteria I have created the following table. below.
Samples    predicted_test    experimentally_validated  Comments
1          0.6               1                         Pathogenic, test correct.
2          0.8               0                         Benign,     test incorrect
3          0.2               1                         Benign,     test correct
4          0.3               0                         Pathogenic  test incorrect
From this data I can to compute sensitivity, specificity, accuracy, PPV and NVP. Finally I want to create a ROC curve.
Looking at tutorials on the internet, they always develop a model (e.g. Logistic Regression ) with train and. My question is why.

