4
$\begingroup$

Given:

$X \sim \mathcal{N}(\mu, \sigma^2)$
$Y|X=x \sim \mathcal{N}(0, (\theta x)^2)$
$Z = X + Y$

I want to be able to make hypothesis tests or confidence intervals for $\mu$ using $Z$ and known $\theta$ and $\sigma^2$. For example, I draw $z = 950$, and I have $\sigma^2 = 10000$ and $\theta = 0.10$. How would I estimate a confidence interval for $\mu$ with this information?

Edit:

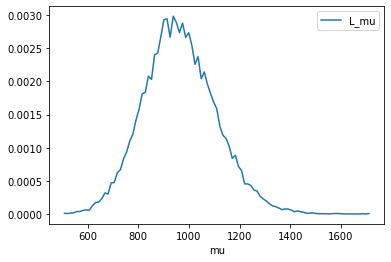
I'm not really sure how to go about this analytically, but I've been able to create confidence intervals numerically. Here's an empirical plot of the likelihood of $\mu$ given the observed $z$ and parameters in the above example.

empirical likelihood plot

Code for the above plot:

import scipy.stats as stats
import numpy as np
import pandas as pd

x_var   = 10000
theta   = 0.10
samples = int(4e7)

df1       = pd.DataFrame(index=range(samples))
df1['mu'] = stats.uniform.rvs(size=samples)*1500+500
df1['x']  = stats.norm.rvs(loc=df1['mu'] , scale=np.sqrt(x_var)         , size=samples)
df1['y']  = stats.norm.rvs(loc=0         , scale=np.abs(theta*df1['x']) , size=samples)
df1['z']  = df1['x'] + df1['y']

z_observed = 950
df1.drop(df1[np.round(df1['z']) != z_observed].index, inplace = True)

hist1 = (pd.DataFrame(np.histogram(df1['mu'],bins=99,density=True))
            .transpose().rename(columns={0: 'L_mu', 1: 'mu'}))
hist1.plot(x='mu',y='L_mu')
$\endgroup$
5
  • $\begingroup$ Nope, not homework. Real work that's got me stumped. I'll add some more information to the post. Thanks. $\endgroup$ Commented Feb 6, 2023 at 19:01
  • 2
    $\begingroup$ The notation "$Y \sim N(0, (\theta X)^2)$" is sloppy because $X$ is random: I guess you meant $Y | X = x \sim N(0, (\theta x)^2)$. $\endgroup$
    – Zhanxiong
    Commented Feb 6, 2023 at 22:08
  • $\begingroup$ @Zhanxiong Would it be possible to get a closed-form likelihood function for $\mu$ from this joint PDF? $\endgroup$ Commented Feb 7, 2023 at 1:37
  • 1
    $\begingroup$ @be_excellent_to_each_other probably not. $\endgroup$
    – Zhanxiong
    Commented Feb 7, 2023 at 2:05
  • $\begingroup$ We can calculate the mean and variance of $Z$ by applying the double expectation formula. In this way confidence interval of $\mu$ can be constructed by CLT. $EZ = \mu$ I think it works if the variance of $Z$ is not a function of $\mu$. $\endgroup$
    – Chia
    Commented Feb 16, 2023 at 3:52

1 Answer 1

3
$\begingroup$

Writing the density of $X$ as $f_X(x)$ and the conditional density of $Y| X=x$ as $f_{Y|x}(y|x)$ we find the joint density as $$ \frac{{\mathrm e}^{\frac{-\left(-x +\mu \right)^{2} \theta^{2} x^{2}-y^{2} \sigma^{2}}{2 \sigma^{2} \theta^{2} x^{2}}}}{2 \sigma \pi \theta {| x |}} $$ which I cannot recognize as a known distribution. We can try to find the density of $Z=X+Y$ by transformation to $(Z=X+Y, Y)$ (which have a jacobian of 1) and then integrating out $y$, I find the joint density of $(Z,Y)$ to be $$ \frac{{\mathrm e}^{\frac{-\left(-z +y +\mu \right)^{2} \left(-z +y \right)^{2} \theta^{2}-y^{2} \sigma^{2}}{2 \sigma^{2} \left(-z +y \right)^{2} \theta^{2}}}}{2 \sigma \pi \theta {| -z +y |}} $$ but trying to integrate out $y$ does not give a closed form: $$ \int_{-\infty}^{\infty}\frac{{\mathrm e}^{\frac{-\left(-z +y +\mu \right)^{2} \left(-z +y \right)^{2} \theta^{2}-y^{2} \sigma^{2}}{2 \sigma^{2} \left(-z +y \right)^{2} \theta^{2}}}}{2 \sigma \pi \theta {| -z +y |}}d y $$ but you could use this expression for finding the likelihood via numerical integration. See Parameter Estimation for intractable Likelihoods / Alternatives to approximate Bayesian computation for other ideas for intractable likelihoods.

Another idea is to calculate the moment generating function, which do have a closed form. It can be found relatively easily via the double expectation theorem (again I jump the details, I did those with maple): $$ \DeclareMathOperator{\E}{\mathbb{E}} M_Z(t)= \E e^{tZ} = \frac{\exp\left\{ -\frac{t(\mu^2 t \theta^2+\sigma^2 t + 2\mu)}{2(\sigma^2 t^2 \theta^2 -1)} \right\}}{\sqrt{1-\sigma^2 t^2 \theta^2}} $$ which is valid as long as the argument of the square root is positive, which is for $t^2 < \frac1{\sigma^2 \theta^2}$. Then we can use the saddlepoint approximation, see How does saddlepoint approximation work?, as an approximate likelihood function.

Out of time now, will add details later.

$\endgroup$

Your Answer

By clicking “Post Your Answer”, you agree to our terms of service and acknowledge you have read our privacy policy.

Not the answer you're looking for? Browse other questions tagged or ask your own question.