2
$\begingroup$

I have two vectors, A and B which I want to compare using the MWU test. Both vectors have the size of 995 with A having a mean and standard deviation of 10.50050 and 2.82287, respectively. The mean and std for B are 10.19397 and 2.87137. The histogram and KDE for the two vectors are as follows. histogram and KDE
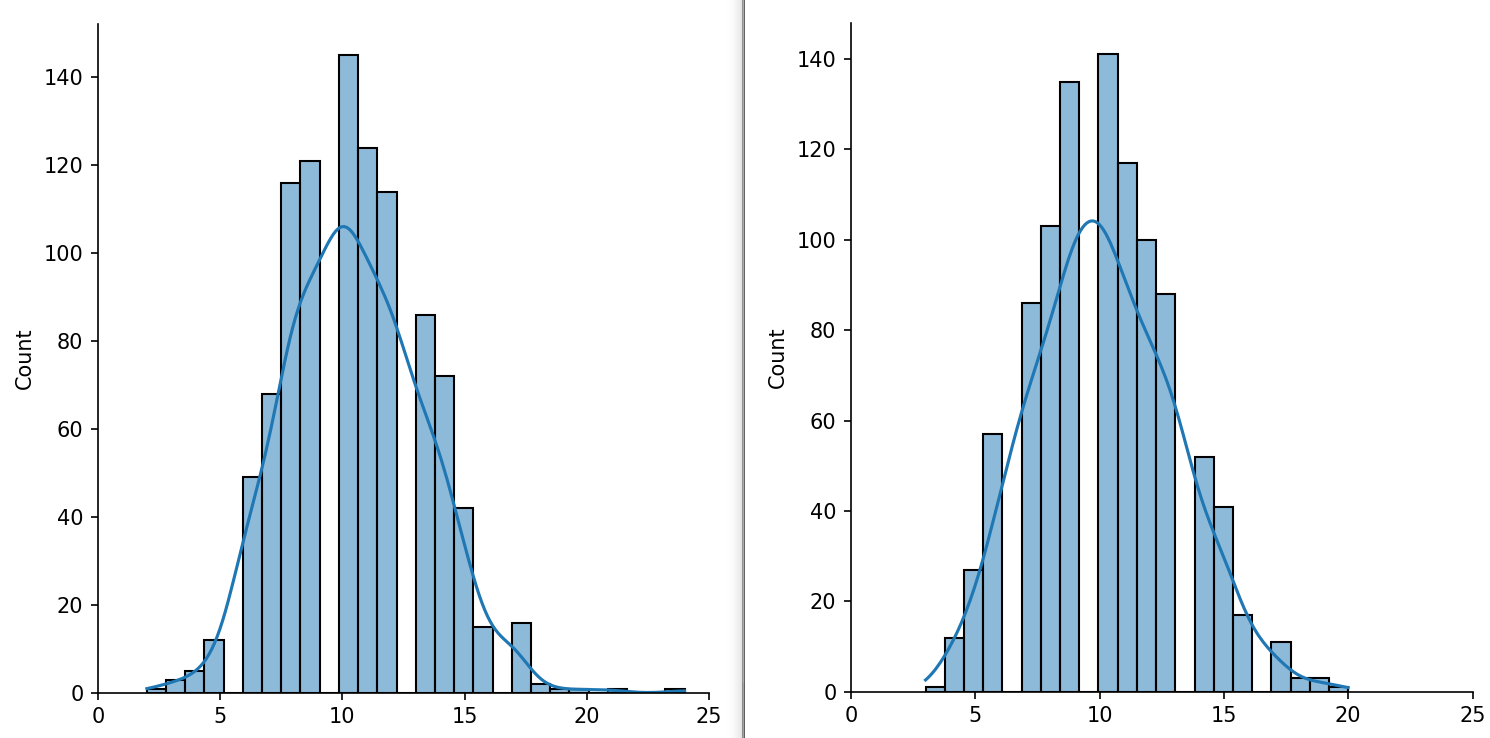
All of this would tell me that the distribution of the vectors are very similar, however, MWU (as implemented in Python SciPy) returns a p value of 0.01764, which I deem relatively low.

Could someone please explain what key concept I'm missing?

Thank you.

$\endgroup$
6
  • 3
    $\begingroup$ You're missing the fact that such tests as these become more sensitive to small effects as the sample size increases. $\endgroup$
    – Galen
    Commented Mar 18, 2023 at 22:27
  • $\begingroup$ I'm experimenting with SciPy' mannwhitneyu method. The default alternative hypothesis is 'two-sided' which returns the low p value. Once it is set to 'less', the p value is 0.99. $\endgroup$
    – hvta
    Commented Mar 18, 2023 at 22:28
  • $\begingroup$ None of this is any mysterious. Your sample size is large so a small difference can easily come out significant, but of course only if it is in the direction of the specified alternative. $\endgroup$ Commented Mar 18, 2023 at 23:04
  • 1
    $\begingroup$ Your histograms have a Moiré pattern. Possibly it is similar to this question/answer. If you change the bin sizes then you might prevent it. $\endgroup$ Commented Mar 18, 2023 at 23:59
  • 1
    $\begingroup$ The histograms are very similar but even by eye their lower tails look different. It would be better to overlay the histograms and the densities in the same plot. Also, since the number of observations is the same -- are the observations perhaps paired? $\endgroup$
    – dipetkov
    Commented Mar 19, 2023 at 0:40

2 Answers 2

1
$\begingroup$
  • With many measurements (like 995), small differences may already become significant. A small effect size can still be significant.

    Also a t-test will show a significant difference. The means have a difference of about $0.3$ and the t-statistic is around $2.4$ giving a p-value of around $0.0166$

    Are smaller p-values more convincing?

    Why is "statistically significant" not enough?

  • Btw, the Mann-Whitney U test is not the same as a t-test and can be significant, even when the means are the same (https://stats.stackexchange.com/a/470512/).

    The MWU test is testing whether $P(X>Y) = P(Y>X)$. This is the case when in a PP-plot the curve divides the plane into two equal areas. So, in relation to a MWU test, a PP-plot might be a better way to visualize the difference rather than two histograms.

$\endgroup$
1
$\begingroup$

One thing I'd like to add to the answer by @SextusEmpiricus is that a useful statistic to report when using an Wilcoxon-Mann-Whitney test is one that reports the probability that an observation in one group being greater than an observation in the other group.

There are several variants of this statistic. Reporting the probability, two are Vargha and Delaney's A and Grissom and Kim's probability of superiority.

These can be transformed to a -1 to 1 scale, like an r value. Examples are the Glass rank biserial coefficient and Cliff’s delta.

I don't know if any of these are available in Python, but they are relatively easy to compute.

My suspicion is that you will find these effect size statistics suggest there is just a small difference in the stochastic dominance between these two distributions.

$\endgroup$

Your Answer

By clicking “Post Your Answer”, you agree to our terms of service and acknowledge you have read our privacy policy.

Not the answer you're looking for? Browse other questions tagged or ask your own question.