What are the appropriate uses for a grouped vs a stacked bar plot?
3 Answers
I think grouped bars are preferable to stacked bars in most situations because they retain information about the sizes of the groups and stay readable even when you have multiple nominal categories. For me, the segments of stacked bars get difficult to compare beyond two categories - and even with just two categories, they can be quite deceptive if your groups are of very different sizes. I'd prefer a frequency table over a stacked bar plot any day.
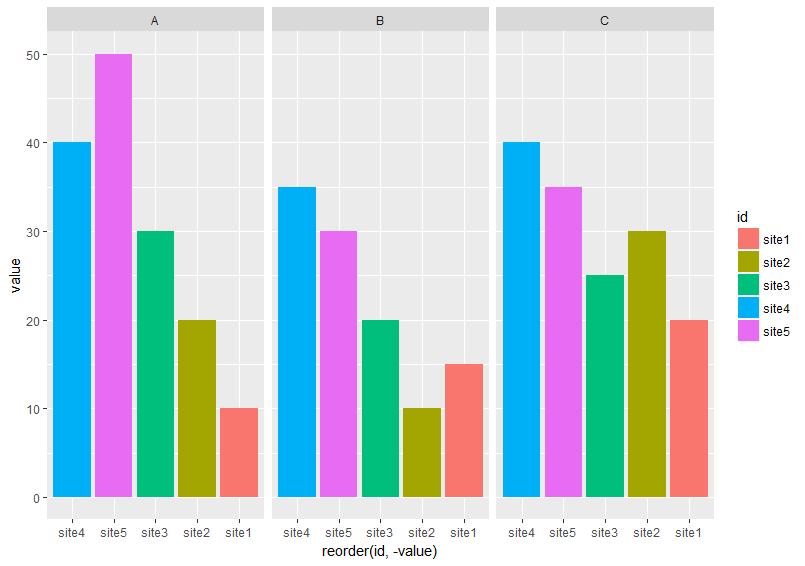
You should also consider a series of bar plots, with each group in a separate plot:

This is probably what I use most often. You can do this in R with facet_wrap and facet_grid inggplot2, as well as thelattice` package.
Historical note: histograms != bar plots
-
4$\begingroup$ (+1) A possible exception is when we have a set of indicators (e.g., items in a questionnaire) with a fixed number of categories (e.g., Likert-type items), as discussed in Visualizing Likert Item Response Data, or a single crossing factor (e.g., gender), in which case an horizontal (we are better at visually discriminating along the horizontal than the vertical axis) stacked barchart might be interesting, IMO. $\endgroup$– chlCommented Jan 11, 2011 at 20:39
-
1$\begingroup$ Excellent point - that mostly negates the concern about varying group sizes, assuming non-response is about even across the questions. I still have difficulty comparing the "slightly concerned" proportions across groups, but the horizontal layout does seem easier. That post is a great resource - thanks for linking it here. $\endgroup$ Commented Jan 11, 2011 at 20:50
-
1$\begingroup$ +1 For the distinction between bar charts and histograms. (The difference becomes very clear when you consider how best to plot histograms with varying intervals, as illustrated at stata.com/support/faqs/graphics/histvary.html.) $\endgroup$– whuber ♦Commented Jan 11, 2011 at 21:52
-
$\begingroup$ I updated to reflect I want bar plots not histograms. $\endgroup$ Commented Jan 12, 2011 at 0:58
-
1$\begingroup$ "example on this page", i think this link is dead $\endgroup$– baxxCommented Jun 5, 2020 at 21:41
Stacked barcharts useless? Here's an appropriate use of one, actually, a hybrid, grouped and stacked bar chart. Lets say I set 1 milliliter of milk aside while passing a 2nd milliliter through a column packed with a resin capable of adsorbing a certain milk component that I'm able to later measure. Let's say I capture any liquid that drips through the column in a tube. Then let's say I wash the column with progressively stronger solvents while capturing the flowthrough of each solvent into a separate tube. Finally, let's say I measure the amount of the milk component in each tube, AND, then also the amount in the other half-milliliter. The plot needs to show (a) how much of the component didn't stick to the column, (b1 through bn) how much 'broke through' with each solvent wash, AND (c) -- here's where the stacked display comes in -- whether the total amount recovered equals the starting amount, i.e., whether some of the component appears to still be stuck on the column.
I don't think there are any appropriate uses of stacked bar charts; grouped bar charts are better, but both are inferior to other plots, depending on what aspect of your data you want to emphasize, and how much data you have.
-
3
-
$\begingroup$ are you able to give an example of "other plots" here please? $\endgroup$– baxxCommented Jun 5, 2020 at 21:42
