5
$\begingroup$

More an aesthetics question to do with presentation of statistical data, say you have 2 sets of data,

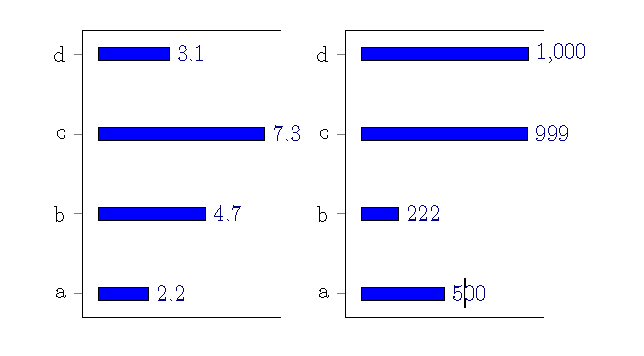
     speed     weight
a      2.2      500
b      4.7      222
c      7.3      999
d      3.1     1000

So if you plot the speeds and weights on the same bar chart, you will get squishy tiny bars for all the speed values (making them unreadable). The data should be viewed together though, because there is some relationship between speed and weight that you're trying to show.

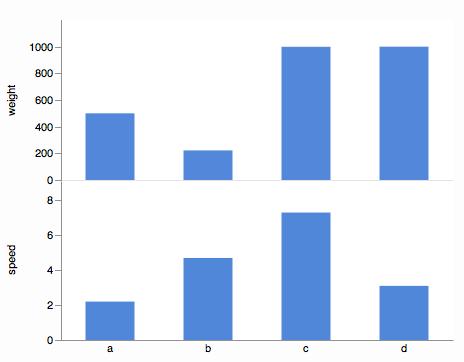
What I came up with was adjacent bar charts:

enter image description here

But it kind of looks redundant, with the repeated axes there.

$\endgroup$

4 Answers 4

2
$\begingroup$

In general, if you have two different measurements on each of a set of observations, and you think there may be a relationship between them, I think it's best to visualize them with a scatterplot. I don't know if you use R, but here is some simple code and a sample plot:

speed  = c(2.2, 4.7, 7.3, 3.1)
weight = c(500, 222, 999, 1000)

windows()
  plot(speed, weight)
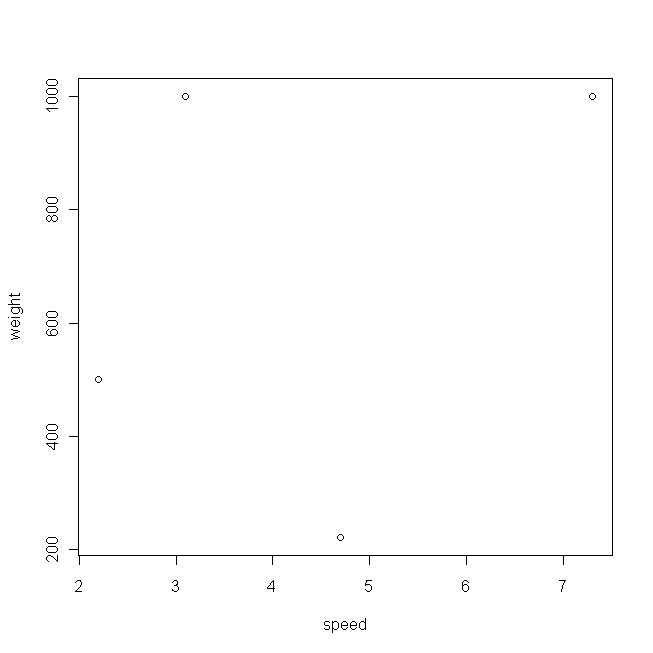
enter image description here This plot doesn't look very exciting, mainly because you only have 4 data points.

Another way to visualize data is to use a dotplot. This is an especially good way to look at data that represent simple magnitudes, which is what would you have, if you were looking at only one of your variables. Note that this is the same thing a bar chart provides, it's just that dotplots have been shown to be easier for people to extract the information. The question is, can you look at two variables at the same time in such a way that you could perhaps see relationships, but without redundancy?

One way to deal with this general problem is to plot two variables on the same plot (in this case, the same dotplot). This sort of thing is very commonly done with time series data in economics (here's one I found through Googling). The trick is to find a way to get two different scales on the same plot. This can be done by rescaling one of the variables in terms of the other; in addition, you must rescale the axis values of the other variable into the terms of the first. These 'rescalings' must be linear transformations so as not to change the data in a meaningful way. The following is some R code that does this in a way which is incredibly kluge-y, but that I hope will be easy to follow:

sM  = mean(speed);     wM  = mean(weight)
sSD = sd(speed);       wSD = sd(weight)

weightZ     = (weight-wM)   / wSD
convertedW  = (weightZ*sSD) + sM

sTicks      = c(0:8)
sTicksZ     = (sTicks-sM)    / sSD
convertedST = (sTicksZ*wSD)  + wM
convertedST = round(convertedST)

sY = seq(from=1.1, to=4.1, by=1)
wY = seq(from=0.9, to=3.9, by=1)


windows()
  plot(speed, sY, pch=1, col="red", axes=F, xlab="", ylab="", ylim=c(0.5, 4.5), xlim=c(0,8))
  points(convertedW, wY, pch=2, col="blue")
  abline(h=c(1:4), lty="dashed", col="lightgray")

  box()
  axis(side=2, at=c(1:4), labels=c("a","b","c","d"))
  axis(side=3, at=sTicks,                          col="red")
  axis(side=1, at=sTicks, labels=convertedST,      col="blue")

  mtext("Speed",  side=3, line=2.5, cex=1.5, col="red")
  mtext("Weight", side=1, line=2.5, cex=1.5, col="blue")

  legend("bottomright", legend=c("Speed", "Weight"), pch=c(1,2), col=c("red","blue"))
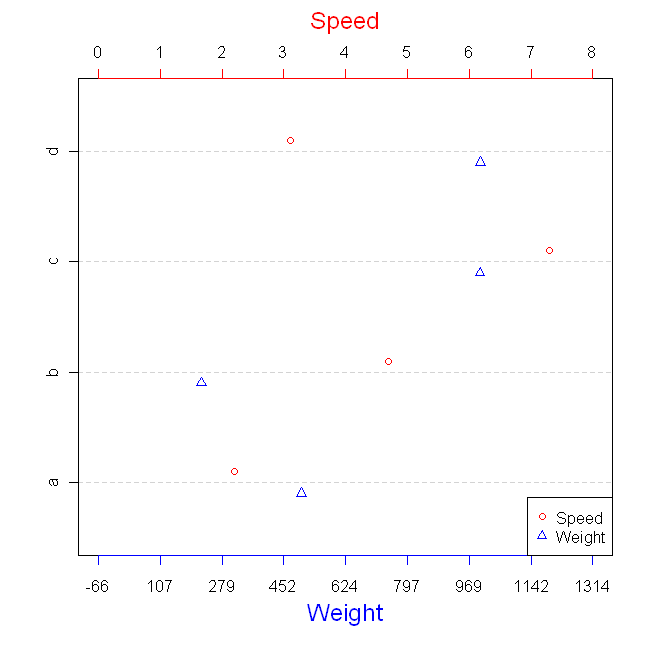
enter image description here
With smaller amounts of data, as you have here, this may be more informative.
$\endgroup$
2
  • $\begingroup$ Actually the two different horizontal axes on the same graph looks very good. It seems I could turn these into bars (and not scatter plot) and have a similar result. $\endgroup$
    – bobobobo
    Commented Jul 14, 2012 at 20:17
  • $\begingroup$ @bobobobo, there's really little difference between a dotplot & a bar chart where the bars run horizontally. Often, bars are used to plot things like group means, instead of raw values (as here), so it could throw someone off. In addition, Cleveland has shown that dotplots are read a little more accurately. But for the most part, there shouldn't be much difference. The key to this is rescaling your data so that they can be plotted together. The transformations I used were via z-scores, which equates their centers & how far they spread out. $\endgroup$ Commented Jul 14, 2012 at 20:28
9
$\begingroup$

It's OK to have two graphs share an axis.

enter image description here

But it's best to avoid one graph with two scales in the same dimension. There is too much potential for misreading (mainly assuming the alignment carries some significance). See the Stephen Few article Dual-Scaled Axes in Graphs: Are They Ever the Best Solution?.

$\endgroup$
3
  • 1
    $\begingroup$ +1 In my opinion, this is the most elegant approach if OP simply intends to efficiently show the weight and speed. If OP actually intends to visualize a dependency between weight and speed, a scatterplot would be preferred, as @gung describes. I also agree with xan that including two axes on a single plot often confuses interpretation and should usually be avoided. $\endgroup$
    – jthetzel
    Commented Jul 15, 2012 at 16:07
  • 1
    $\begingroup$ There are good points here, but I don't necessarily agree. I think the best approach is going to depend on various factors. Few's article is interesting (thanks for the link, btw) but it's worth noting his point is people might be confused. Moreover, his advice is for the presentation of business data to people from a wide variety of backgrounds. Yes, it is crucially important that graphs quickly & clearly communicate the important information & not mislead. But, which strategy does this can depend on the audience. $\endgroup$ Commented Jul 15, 2012 at 16:58
  • $\begingroup$ In econ eg, time-series plots with 2 dif axes are commonly used, and people don't make the erroneous assumptions Few warns against, so they don't need to be "suppressed". OTOH, bar charts are commonly used to display group-level statistics, eg means, rather than simple magnitudes like here. Thus, bars could be misleading in some situations. Furthermore, Cleveland has shown that horizontal distances are more accurately read than vertical & dotplots more than bar charts. Thus, this might be a better strategy, but it might not. $\endgroup$ Commented Jul 15, 2012 at 16:58
3
$\begingroup$

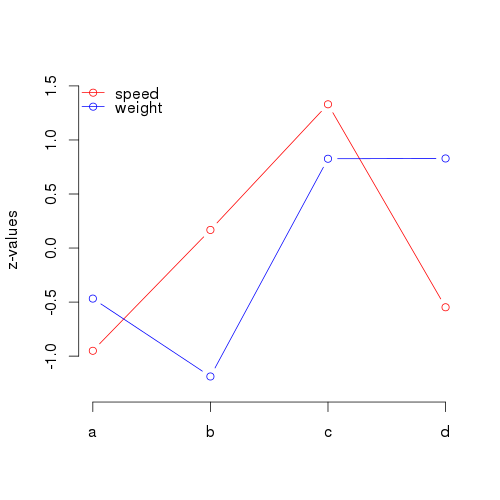
You could also transform absolute scales into relative by using z-transformation (or any other that you think is more suitable).

speed  = c(2.2, 4.7, 7.3, 3.1)
weight = c(500, 222, 999, 1000)
speed=scale(speed)
weight=scale(weight)
rng=extendrange(range(c(speed,weight)))

plot(speed, type="b", col="red", ylim=rng,ylab="z-values",xlab="",xaxt="n",bty="n")
points(weight, type="b",col="blue")
legend("topleft",legend=c("speed","weight"),col=c("red","blue"),lty=1, bty="n",pch=1)
axis(1, at=lbls, labels=lbls)

enter image description here

The nice feature of this approach is that it can be used on more than two scales. And although it is not as informative on the values of individual points, it makes scales more comparable.

$\endgroup$
2
  • $\begingroup$ Oops, I overlooked z-transformation in gung's comment. Shame on me. $\endgroup$ Commented Jul 14, 2012 at 23:36
  • $\begingroup$ No problem, it's always nice to have another way to do it, even if it's just a different version of the same. +1 $\endgroup$ Commented Jul 14, 2012 at 23:38
0
$\begingroup$

Given that your data sets are different by orders of magnitude you might want to use logarithmic scale for your x-axis (or take the log of all samples before plotting.) That way the you can still see the variation within the same order of magnitude relatively clearly while the empty space between the sets is condensed.

Example in R:

speed  = c(2.2, 4.7, 7.3, 3.1)
weight = c(500, 222, 999, 1000)

barplot(rbind(speed, weight), log='x', beside=T, horiz=T,
        legend.text=T, args.legend=list(x='right'))
$\endgroup$

Your Answer

By clicking “Post Your Answer”, you agree to our terms of service and acknowledge you have read our privacy policy.

Not the answer you're looking for? Browse other questions tagged or ask your own question.