2
$\begingroup$

I was trying to simulate the Central Limit Theorem in R. Unfortunately, even in large samples (e.g., 80), the Anderson–Darling test could not recognize normality. Therefore, I wrote the following code to see when the p-values become large enough so that the null hypothesis is not rejected.

The results were quite peculiar...

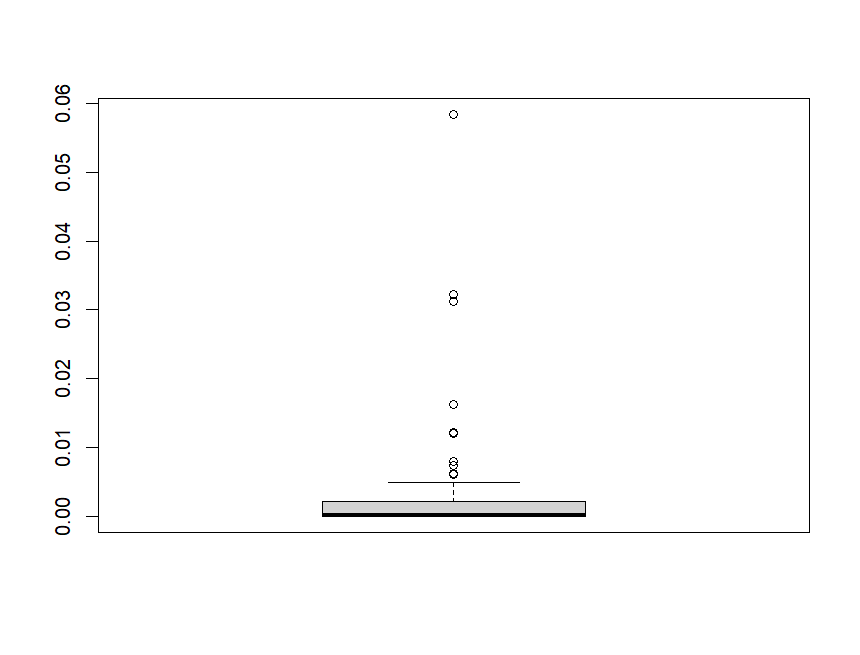
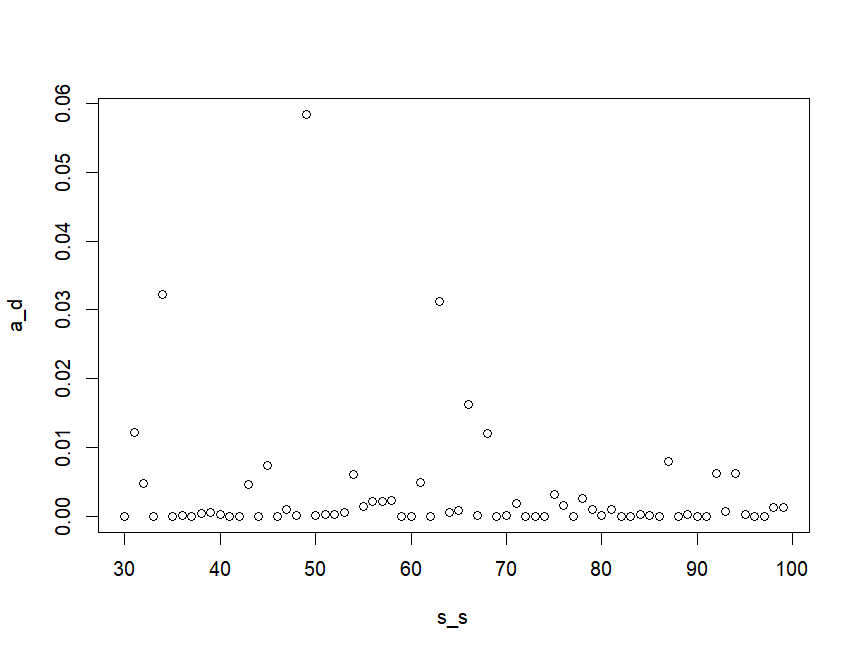
Firstly, it seems that the ability to reject the null hypothesis is rare. enter image description here Secondly, there appears to be periodicity in the p-values that are not significant. This periodicity persists even when I remove or modify set.seed(i+n_s*j). enter image description here
Why does this happen?

This is my code:

library(nortest)
# Number of experiments for recording p-values
n_e <- 70
# Creating a list for the p-values
a_d <- rep(0, n_e)
# Number of samples to be examined
n_s <- 1000
# Size of each sample
s_s <- 30:(30+n_e-1)
for (j in 1:n_e){
  # Creating a list for sample means
  s_m <- rep(0, n_s)
  for (i in 1:n_s) {
    # Specifying the sample distribution
    set.seed(i+n_s*j)
    r_n <- rexp(s_s[1], 8)
    # Sample mean
    m <- mean(r_n)
    # Populating the list with sample means
    s_m[i] <- m
  }
  # Populating the list with p-values
  a_d[j] <- ad.test(s_m)$p.value
}
plot(s_s, a_d)
boxplot(a_d)
$\endgroup$
2
  • 1
    $\begingroup$ The CLT does not say anything about finite sample sizes. Don't expect the distribution of standardized means to be exactly normally distributed at any finite sample size (an exception is if the parent population is normal). In that light, using a formal normality hypothesis test seems futile. Importantly: Failure to reject normality does not mean that the sample is normally distributed. $\endgroup$ Commented Aug 3, 2023 at 9:22
  • $\begingroup$ @COOLSerdash , However, in practice, we only have finite samples. Moreover, as far as I know, the Central Limit Theorem (CLT) is not limited to samples from a normally distributed population but holds more generally. The issue is that these requirements for the CLT practically invalidate the use of the z-test and confidence intervals for the population mean. $\endgroup$ Commented Aug 3, 2023 at 11:48

3 Answers 3

1
$\begingroup$

You are repeating the experiment each tie with sample size s_s[1] which equals 30. This is insufficient to make the CLT kick in. If you increase it, you will see that the p-value distribution becomes uniform.

$\endgroup$
10
  • $\begingroup$ You're right! I didn't notice that. Unfortunately, the problem persists even if I change s_s[1] to s_s[j]. $\endgroup$ Commented Aug 3, 2023 at 8:51
  • 1
    $\begingroup$ 30 is just a rule of thumb for data that are already close to normality anyway. Speed of convergence (i.e. the sample size needed to see normality) depends on many factors, e.g. on skewness of the data. Since you draw data from an exponential distribution, larger sample sizes may be needed. $\endgroup$
    – Knarpie
    Commented Aug 3, 2023 at 9:24
  • 2
    $\begingroup$ @Kώστας If you believe that "n=30" is sufficient, try lognormal with $\sigma=4$ -- e.g. try x=replicate(10000,mean(rlnorm(1000,-5,4))). That's means of sample size 1000. Try: hist(x) and hist(log(x)). Notice that the log of the means is still somewhat right skew, even though the things being averaged must be symmetric on the log-scale. .... this is a distribution for which the actual CLT holds (which theorem says nothing whatever about n=30, or any other finite sample size). Then try replacing the sample size of 1000 with a sample size of 100000 (you'll want to drop the number of sims). $\endgroup$
    – Glen_b
    Commented Aug 3, 2023 at 11:22
  • 1
    $\begingroup$ 1. Testing is pointless; unless the original population distribution was already normal, the null is always false at any finite sample size. Why test null hypotheses guaranteed to be false? The reason why p-values don't seem to "settle" down is goodness of fit test's ability to pick up deviation from non-normality improves with sample size. 2. "effectiveness of the z-test and confidence intervals" Testing normality doesn't measure "effectiveness";' what matters for a test is accuracy of significance level and maintaining power. What matters for a CI is maintaining coverage and average width $\endgroup$
    – Glen_b
    Commented Aug 3, 2023 at 13:22
  • 1
    $\begingroup$ 3. "That is, since the sample means of ANY distribution follow a normal distribution" This assertion is simply false... and it's not what the CLT says. $\endgroup$
    – Glen_b
    Commented Aug 3, 2023 at 13:23
0
$\begingroup$

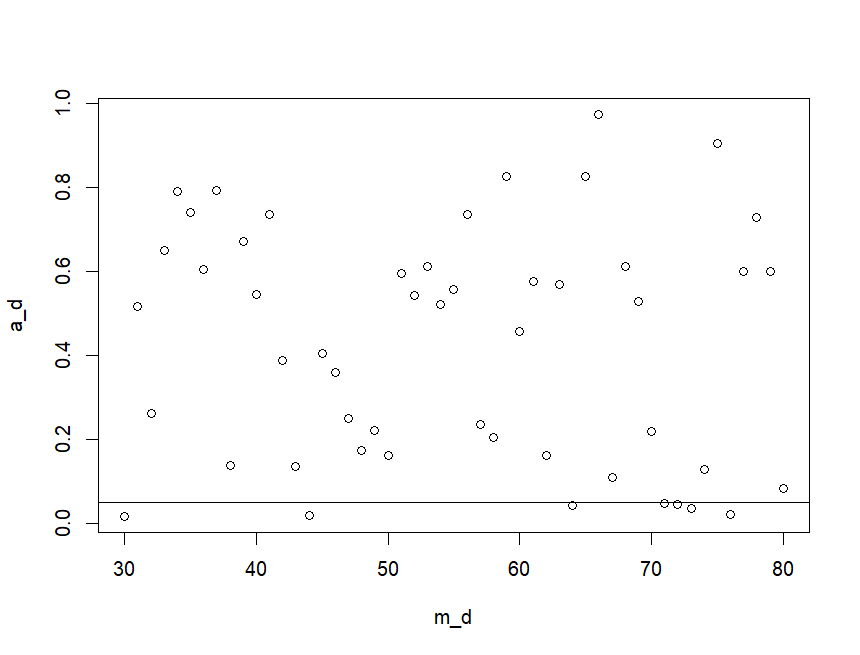
I think I found my mistake. Instead of creating a population that is exponentially distributed and then drawing samples and calculating their means, I was continuously generating exponentially distributed populations and calculating their means. After the correction (see below), it seems to work even for sample sizes ranging from 30 to 80 (see the image).

enter image description here

library(nortest)
# We will start with samples of size d1 and end up with size d2
d1 <- 30
d2 <- 80
# Size of each sample
m_d <- d1:d2
# In each iteration, for each sample size,
# we will examine p_d samples of this size,
# recording their p-values
p_d <- 1000
# The list of p-values will consist of d2-d1+1 p-values,
# one for each sample size case
a_d <- rep(0, d2-d1+1)
# Population
pl <- runif(10000, min=0, max=1)
#pl <- rexp(10000, 8)
# Index for a_d
k <- 1
# Index for set.seed
s_s <- 1
for (j in m_d){
  # Creating the list with sample means
  d_m <- rep(0, p_d)
  for (i in 1:p_d) {
    # Determining the sample distribution
    set.seed(10*s_s)
    r_n <- sample(pl, size = j)
    # Sample mean
    m <- mean(r_n)
    # Enriching the list with sample means
    d_m[i] <- m
    s_s <- s_s+1
  }
  # Normalizing the list of sample means
  #d_m <- (d_m-mean(d_m))/sd(d_m)
  # Enriching the list with p-values
  a_d[k] <- ad.test(d_m)$p.value
  k <- k+1
}
plot(m_d, a_d)
abline(h = 0.05)
$\endgroup$
0
$\begingroup$

The parameters of the simulation are not well calibrated. The CLT is an asymptotic result so, for a finite sample of any size, the actual sampling distribution of the mean is close to but not exactly normal. So, you can choose enough experimental replications to make a normality test arbitrarily powerful - that is to say, I'd reject the hypothesis that the distribution of the sample mean is normal with a given probability encroaching 1. Even if the sample size is 10,000 and the "CLT kicks in" as one answer states, I can change the number of experimental replications to 1,000,000 or more to get that test to reject normality almost every time.

The AD test is not giving you false positives here, the data are not normal. You can understand this simulation a little bit better if you caveat the results by saying the $p$ value from the AD test is used as a pragmatic measure of similarity to the normal distribution.

$\endgroup$

Your Answer

By clicking “Post Your Answer”, you agree to our terms of service and acknowledge you have read our privacy policy.

Not the answer you're looking for? Browse other questions tagged or ask your own question.